Plotting Paper Presentation Template Bilateral Bar Graph – The Perfect Choice for Market Analysis
RJ0200023_8
- Last Update 04/03/2025
- File Size 3.3MB
- # of Slides 2
- File Format PPTX
- Slide Ratio 16:9
- Color
Keywords
- #Content-Based Slides
- #Design-Based Slides
- #Market and Competitor Analysis
- #Marketing Plan and Strategy
- #Graph
- #Customer Analysis
- #Marketing Strategy
- #Horizontal Bar
- #Double Horizontal Bar
- #16:9
- #bilateral bar chart PowerPoint
- #two-sided comparison chart slide
- #symmetrical bar graph template
- #market analysis PowerPoint slide
- #competitive analysis chart presentation
About the Product
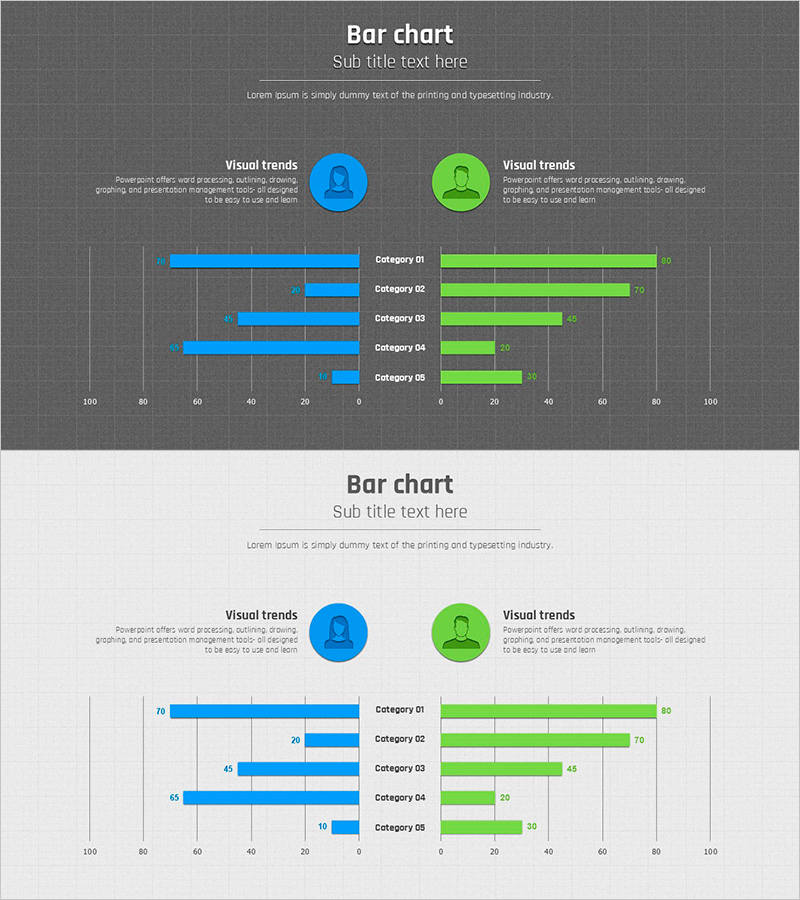
A symmetrical bilateral bar chart PowerPoint slide featuring left-right data comparison across 5 categories. Blue and green bar series enable side-by-side analysis for competitive benchmarking, demographic segmentation, regional performance comparison, and product A vs B evaluation. The 16:9 widescreen 2-slide deck includes clear numerical labels and gridlines for precise data communication. Ideal for market analysis, customer segmentation, and strategic planning presentations where dual-axis comparison drives decision-making.
Usage Points
-
Main Usage
Visualize competitive positioning, demographic splits, regional performance gaps, and product performance contrasts by displaying dual datasets side-by-side. Supports market research presentations, customer analysis reports, sales performance reviews, and strategic planning sessions where comparative insights drive business decisions.
-
How to Use
Open the slide and input numerical values for each category; bar lengths adjust automatically. Customize blue and green colors to match corporate branding or change category labels to reflect actual comparison items (competitor names, regions, products). Retain gridlines and axis labels for data clarity and professional appearance.
-
Recommended For
Marketing teams presenting market analysis, sales teams comparing competitor performance, executives reviewing regional or demographic metrics, consultants visualizing benchmark data, and academic presenters displaying statistical comparisons. Suitable for any business presentation requiring dual-axis data visualization.
-
Slide Structure
2-slide deck: Slide 1 features dark charcoal background with 5 blue bars (left) and 5 green bars (right) in symmetrical arrangement, each with numerical labels. Slide 2 uses light gray background with identical layout for flexible presentation environments. Both slides are 16:9 widescreen format optimized for modern projectors and digital displays.
Related Products
-

Horizontal Bar Chart Comparison – Presenting Effective Marketing Strategies
#Market and Competitor Analysis #Marketing Plan and Strategy #Graph
-

Stylish Learning Icons and Content Description Slide
#Market and Competitor Analysis #Marketing Plan and Strategy #Diagram
-

Gender Ratio Analysis Bar Graph – Customer Analysis and Competitive Advantage
#Market and Competitor Analysis #Graph #Customer Analysis
-

Customer Analysis Bundled Vertical Bar Chart – A Clear View of Market Trends
#Market and Competitor Analysis #Marketing Plan and Strategy #Graph
