Visualizing Market Analysis with Doughnut Chart – Stylish Presentation
RJ0200023_33
- Last Update 04/03/2025
- File Size 3.3MB
- # of Slides 2
- File Format PPTX
- Slide Ratio 16:9
- Color
Keywords
About the Product
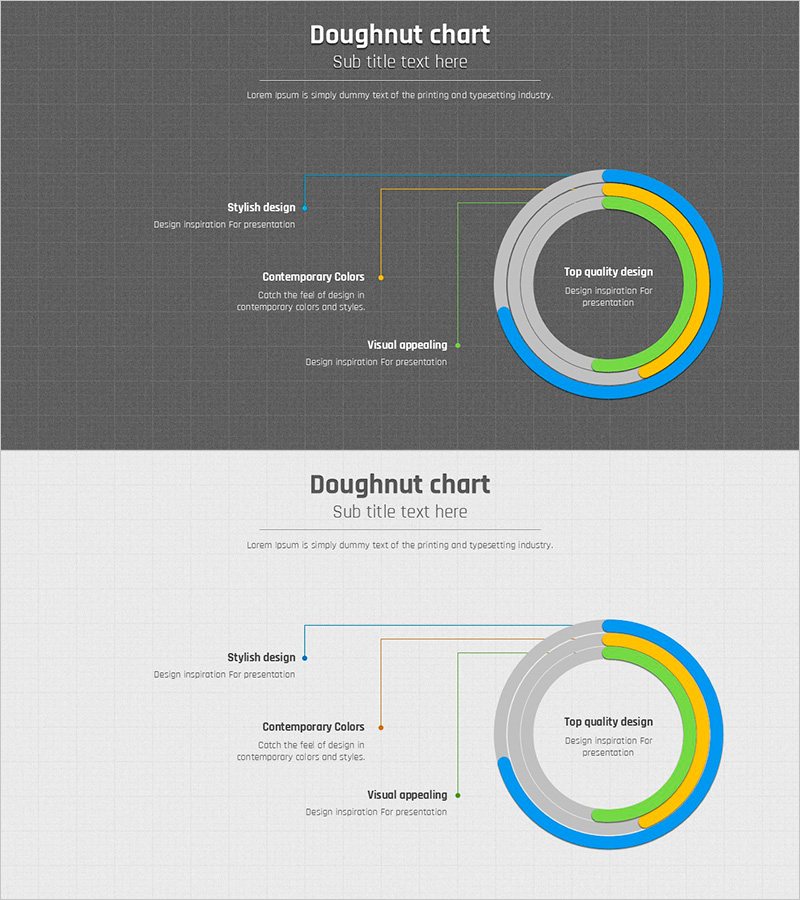
A doughnut chart PowerPoint slide designed for market analysis and competitive comparison. The circular graph features four color segments—blue, yellow, green, and gray—to visualize proportion data intuitively. Two background versions (dark and light) are included, with a text area on the left for adding descriptions of three key items. Provided in 16:9 widescreen format with 2 slides, fully editable for immediate presentation use.
Usage Points
-
Main Usage
Visualizes proportion data such as market share, product composition, or customer distribution using a doughnut chart. The center of the donut displays key metrics, while the left text boxes explain the meaning of each color segment.
-
How to Use
Use in market analysis, competitive comparison, or business overview sections of presentations. Input numerical values for each color segment, and the proportions update automatically. Modify text boxes to add descriptions. Select the dark background for projector environments and the light background for printing.
-
Recommended For
Ideal for marketing professionals, planners, and executives presenting market conditions, product portfolios, or customer composition. Suitable for business plans, proposals, quarterly reports, and investor presentations.
-
Slide Structure
2-slide set: Slide 1 features a dark gray background with a 4-segment doughnut chart (blue, yellow, green, gray), left-side text boxes for 3 items with connecting arrows. Slide 2 has identical structure with light gray background. 16:9 widescreen format, all elements fully editable.
Related Products
-

Shareholder Status Distribution Analysis Chart – Visualizing Shareholder Information
#Company Introduction #Market and Competitor Analysis #Diagram
-

Visual Insights on Education Analysis PowerPoint
#Market and Competitor Analysis #Diagram #Graph
-

Shareholder Status Analysis Chart & Description – Sleek Diagram
#Company Introduction #Market and Competitor Analysis #Diagram
-

Shareholder Status Survey Donut Graph – Optimized for Market Analysis
#Company Introduction #Market and Competitor Analysis #Diagram
