Plotting Paper Presentation Template with Doughnut Chart
RJ0200023_9
- Last Update 04/03/2025
- File Size 3.3MB
- # of Slides 2
- File Format PPTX
- Slide Ratio 16:9
- Color
Keywords
About the Product
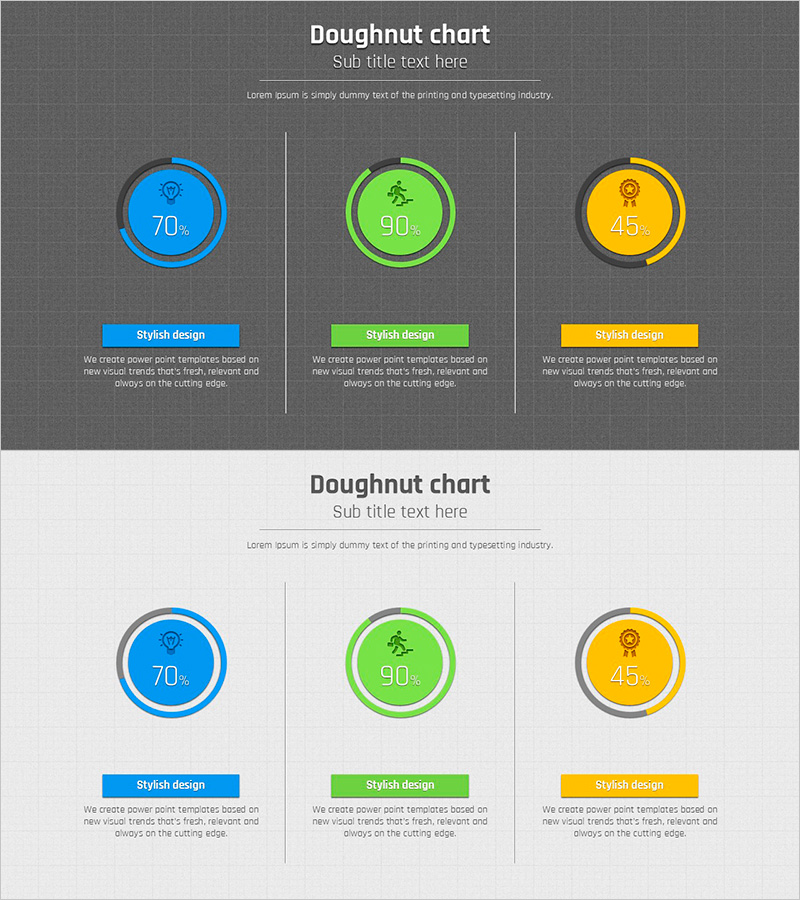
A PowerPoint slide featuring three doughnut charts that visualize proportional data with blue, green, and orange color segments. Each circular chart displays percentage values at the center with corresponding icons, creating an intuitive visual representation of data distribution. The dark gray background contrasts sharply with the bright chart colors, making the slides stand out in presentations. Below each doughnut chart is a text area for adding detailed descriptions of each category. Two layout variations—dark and light backgrounds—are included, allowing flexible adaptation to different presentation environments and corporate branding requirements.
Usage Points
-
Main Usage
Effectively visualize proportional data such as sales ratios, market share, budget allocation, and customer demographics using three-segment doughnut charts. The hollow center of each donut allows for adding key metrics or titles, enhancing information clarity and visual hierarchy.
-
How to Use
Replace the percentage values and icons in each doughnut chart with your actual data. Add category descriptions in the text boxes below each chart. Customize colors to match your corporate brand guidelines. Select either the dark or light background layout based on your presentation environment and design preferences.
-
Recommended For
Ideal for marketing reports, business analysis presentations, financial performance reviews, and customer segmentation analysis. Suitable for sales teams, planning departments, and executive briefings. Also effective in educational seminars and training materials for statistical data visualization.
-
Slide Structure
Two-slide layout: Slide 1 features dark gray background with three doughnut charts in blue, green, and orange; Slide 2 uses light background with identical chart arrangement. Each chart displays percentage at center with icon, text description area below. 16:9 widescreen format optimized for modern presentation standards.
Related Products
-

Map Donut Graph for Visualizing Market Share – Symbol of Practicality and Change
#Product/Service Introduction #Market and Competitor Analysis #Graph
-

Donut Chart Slide for Major Cultivation Countries
#Product/Service Introduction #Market and Competitor Analysis #Graph
-

Development Status Donut-Shaped Circle Graph – Visualizing Market Share
#Product/Service Introduction #Market and Competitor Analysis #Graph
-

Exercise Objectives Achieved Diagram & Chart – Post-Progress
#Product/Service Introduction #Business Introduction #Diagram
