Graph Plotting Paper Template Horizontal Bar Segmentation
RJ0200023_12
- Last Update 04/03/2025
- File Size 3.3MB
- # of Slides 2
- File Format PPTX
- Slide Ratio 16:9
- Color
Keywords
- #Content-Based Slides
- #Design-Based Slides
- #Business Strategy
- #Market and Competitor Analysis
- #Graph
- #Competitor Analysis
- #Horizontal Bar
- #Segmented Horizontal Bar
- #Project Progress
- #16:9
- #100% stacked bar chart PowerPoint
- #stacked horizontal bar graph
- #data visualization slide
- #market share comparison
- #competitive analysis chart PowerPoint
About the Product
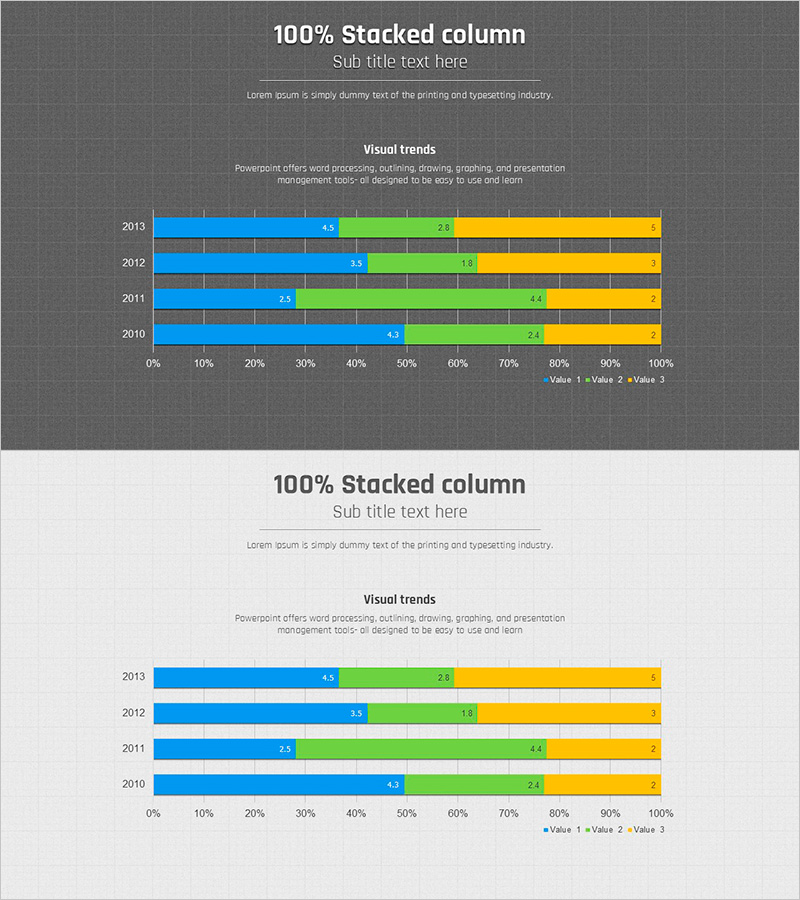
A PowerPoint slide featuring a 100% stacked horizontal bar chart that visualizes year-over-year data trends from 2013 to 2010 across three value series (Value 1, Value 2, Value 3). Each series is color-coded in blue, green, and yellow for clear differentiation. The grid paper background enables easy data entry and editing, making it ideal for market share analysis, competitive benchmarking, and budget allocation visualization. Delivered in 16:9 widescreen format with 2 slides ready for immediate presentation use.
Usage Points
-
Main Usage
This slide is designed to display both the composition ratio and trend changes of data across years or categories simultaneously. The 100% stacked format allows clear comparison of relative proportions for each series, making it ideal for presenting market share evolution, budget distribution, sales composition, and customer segmentation analysis.
-
How to Use
Enter numerical values directly into the grid paper background to update the chart. The blue, green, and yellow series colors can be customized to match your corporate branding. Year labels, category names, and legend text are fully editable. Simply insert the slide into your business reports, marketing analyses, or financial presentations.
-
Recommended For
Ideal for executives, marketing teams, finance departments, and sales teams presenting quarterly or annual performance analysis and competitive positioning. Particularly effective for communicating market share shifts, product portfolio composition, customer portfolio analysis, and budget allocation status to stakeholders.
-
Slide Structure
Two-slide set with the first slide featuring a dark background displaying 4 stacked horizontal bars (2013–2010) with data value labels. The second slide presents the same chart structure on a light background for versatility across different presentation environments. Grid paper background throughout ensures precise data entry and visual consistency.
Related Products
-

Service System Analysis Graph – Market and Competitor Analysis
#Market and Competitor Analysis #Graph #Competitor Analysis
-

Space Industry Development Status Graph – Key to Market Analysis
#Market and Competitor Analysis #Graph #Competitor Analysis
-

Market Analysis Bar Graph – Effective Visualization for Competitor Analysis
#Market and Competitor Analysis #Graph #Competitor Analysis
-

Business Partner Analysis Bar Graph – Market Insights
#Market and Competitor Analysis #Graph #Competitor Analysis
