Thinking Presentation Template – Attention-Grabbing in Teal and Minimalist Design
J0300032
- Last Update 12/19/2024
- File Size 3.4MB
- # of Slides 20
- File Format PPTX
- Slide Ratio 16:9
- Color
Slide Preview
Keywords
About the Product
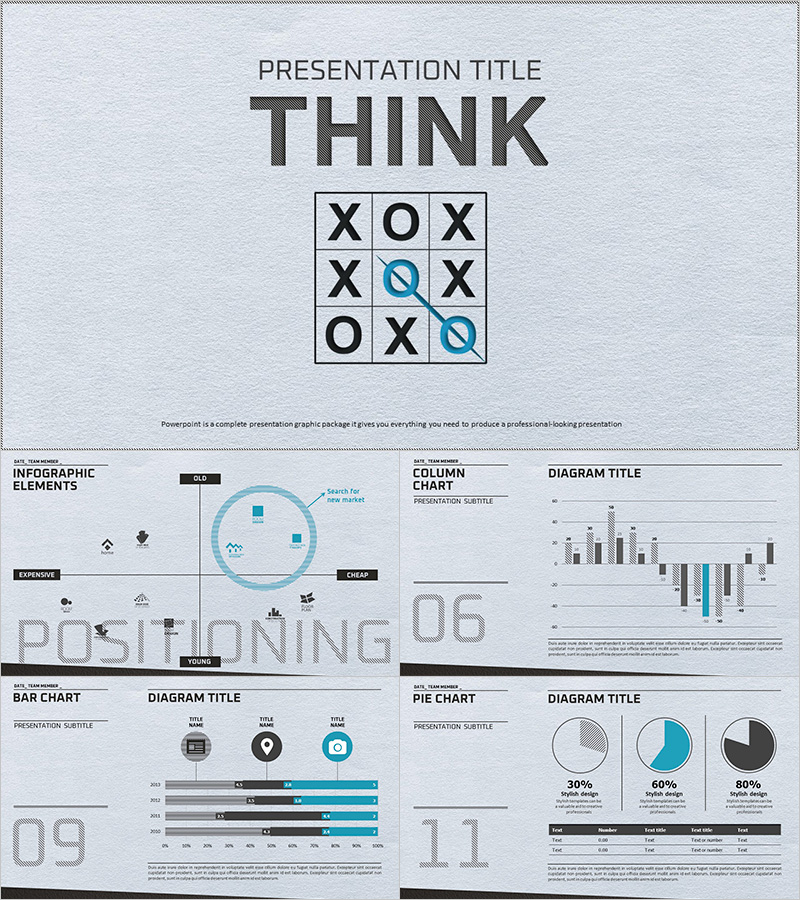
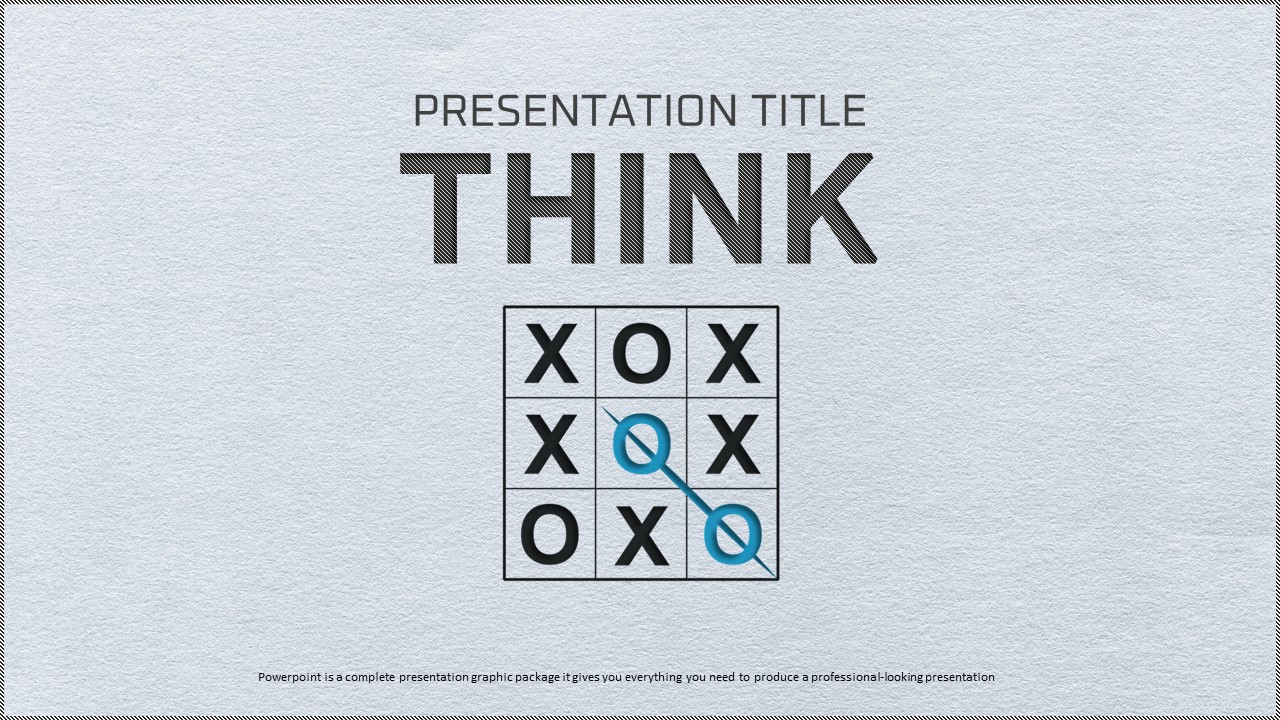
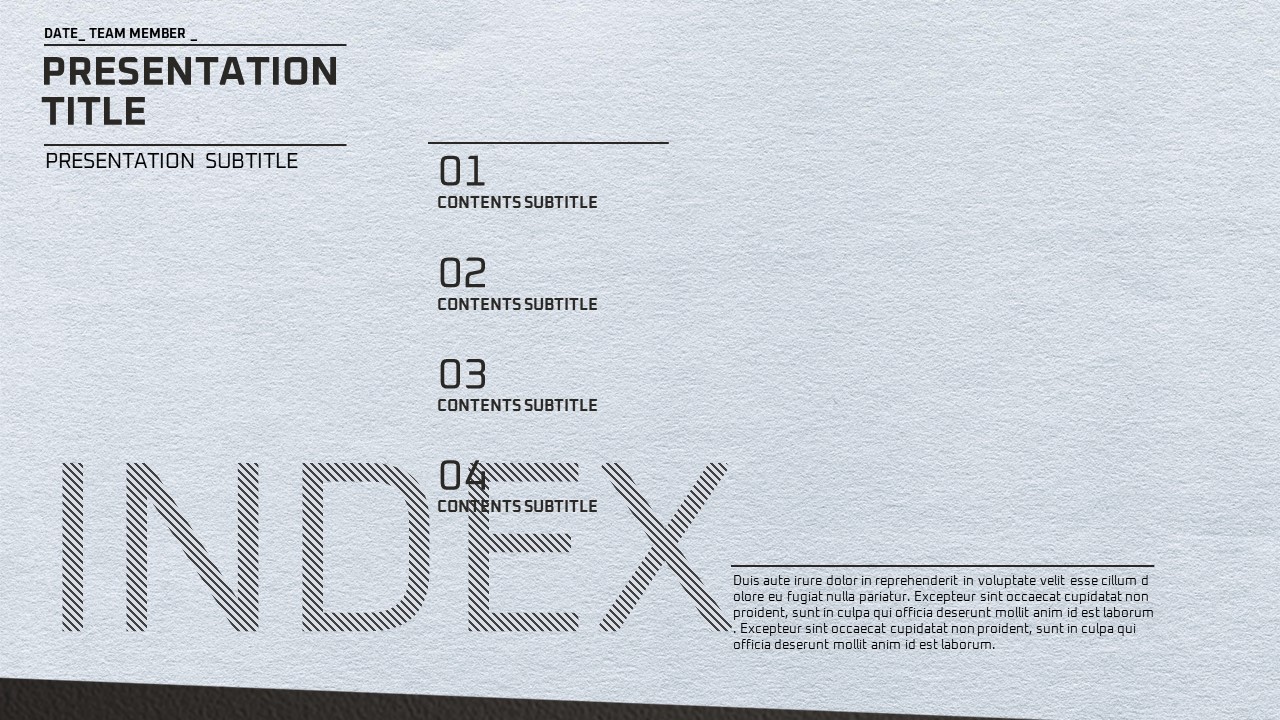
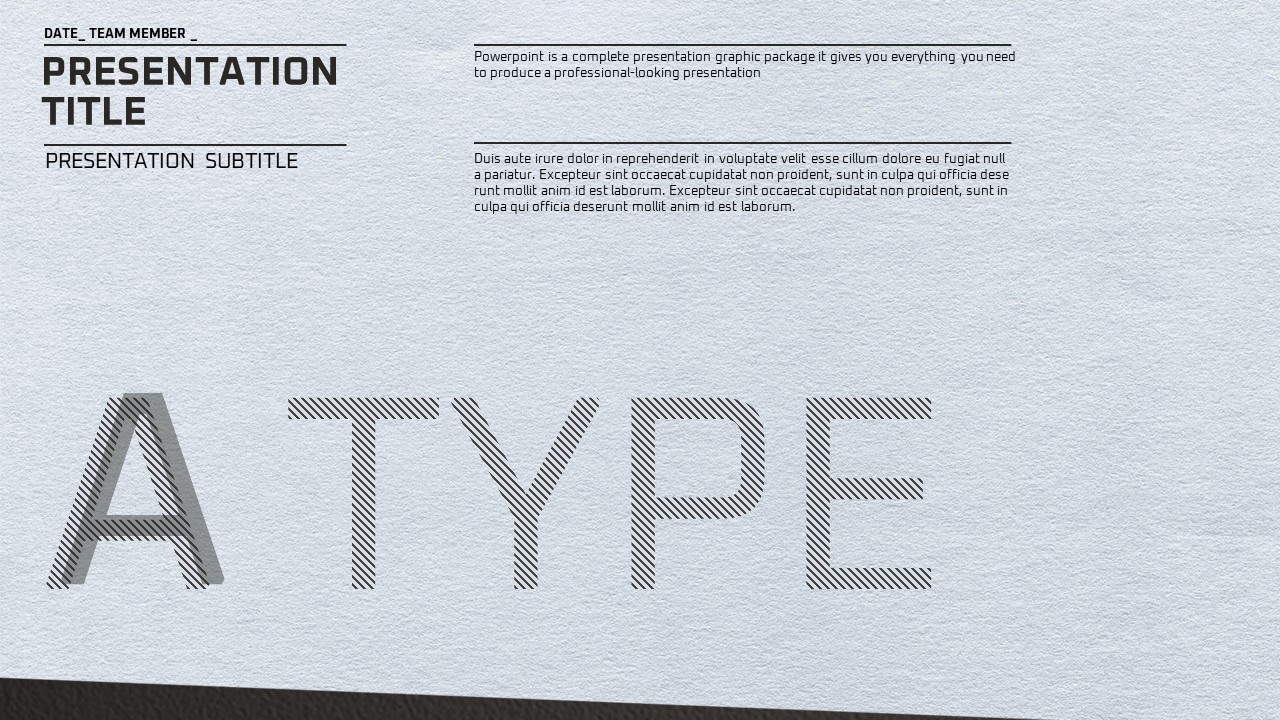
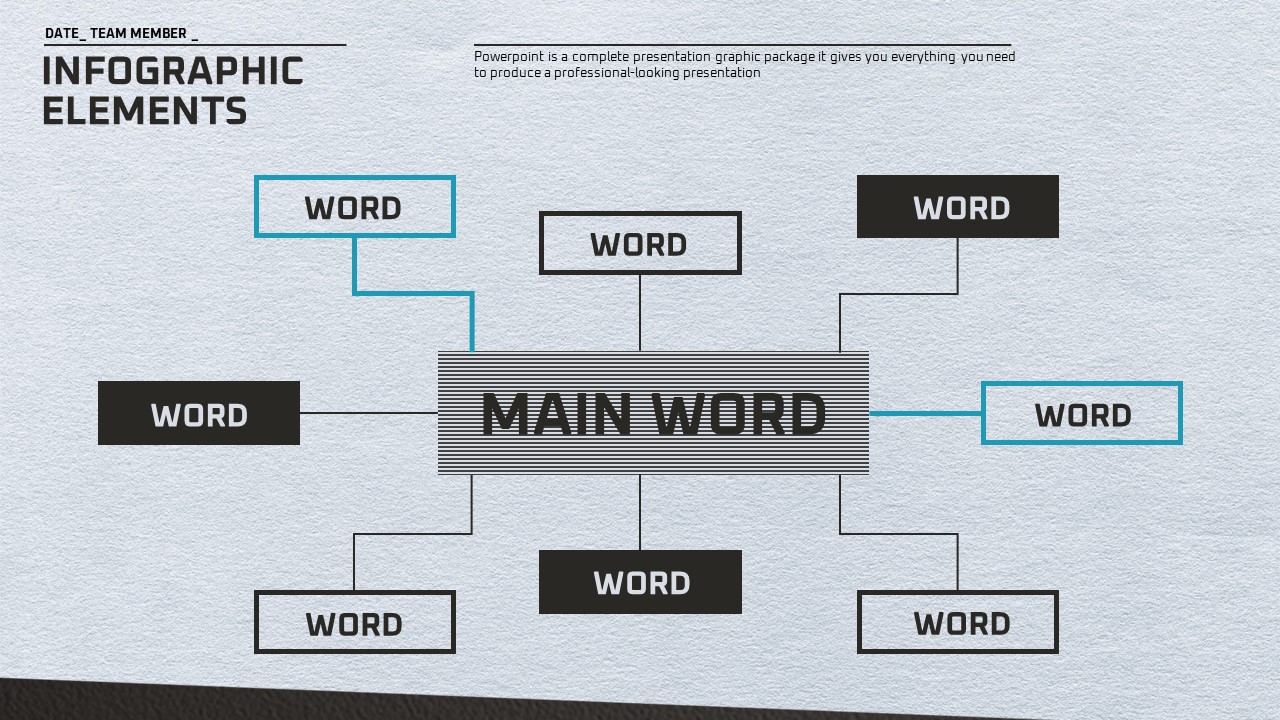
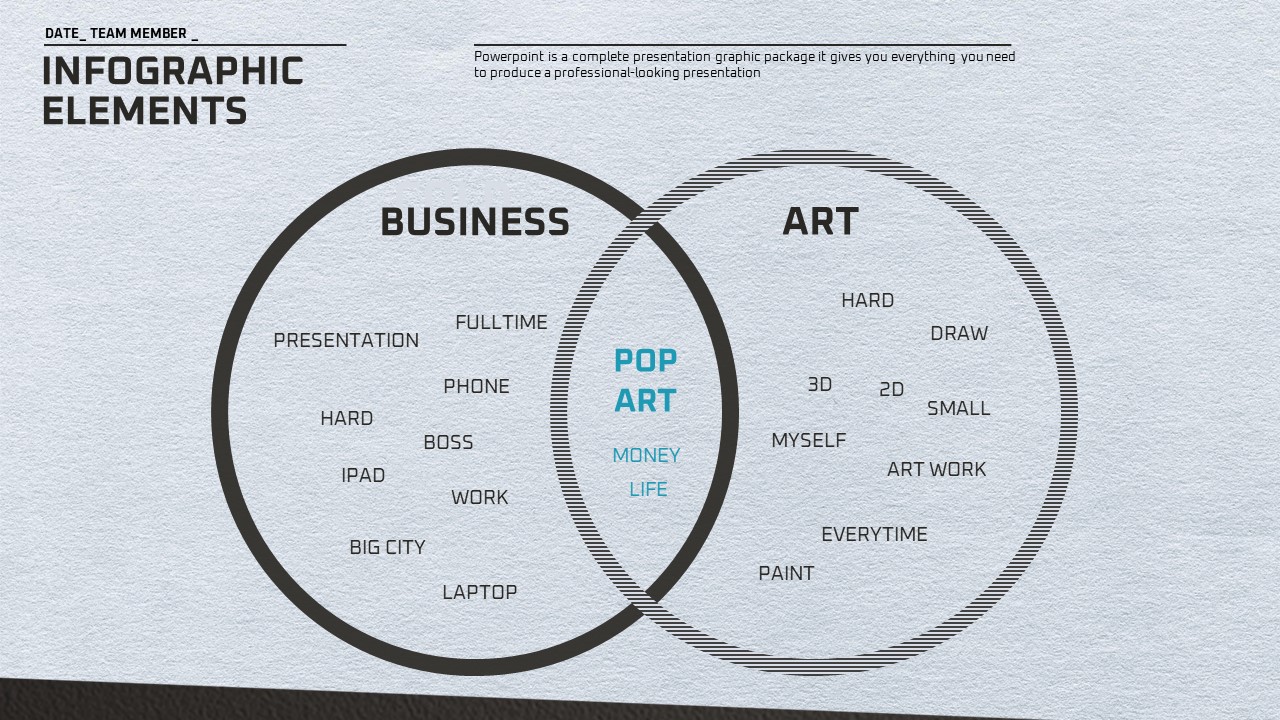
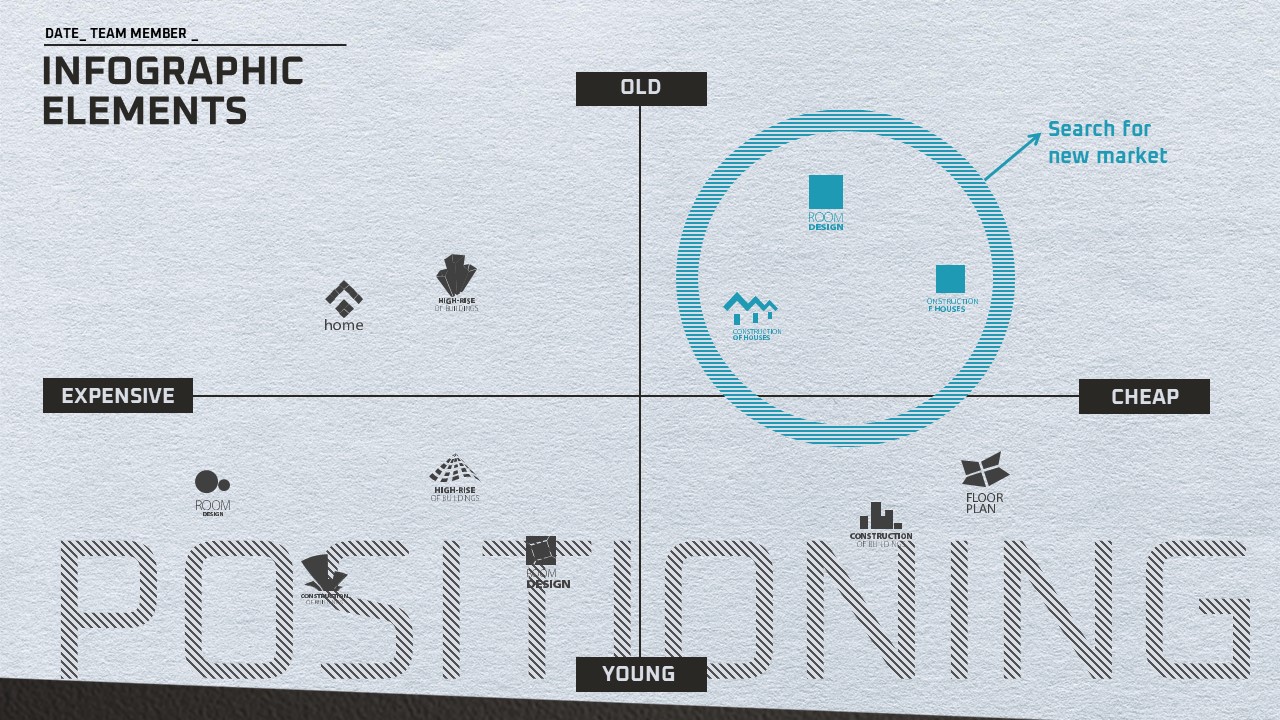
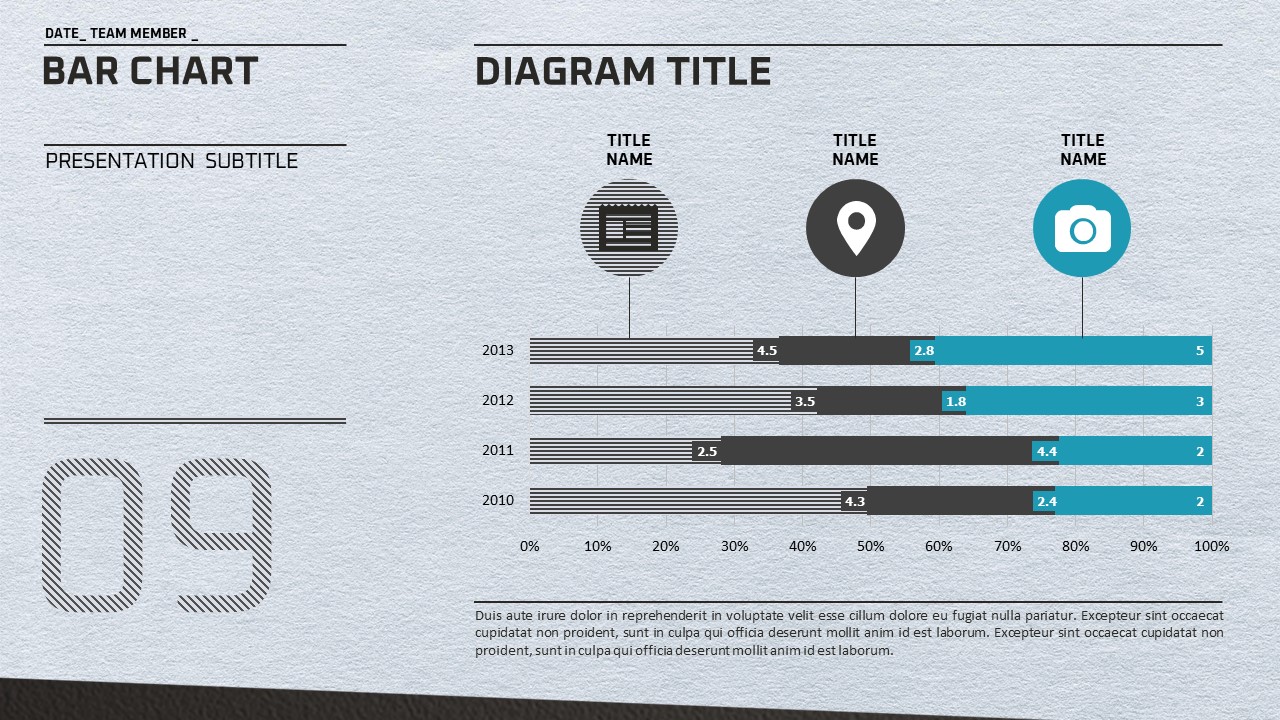
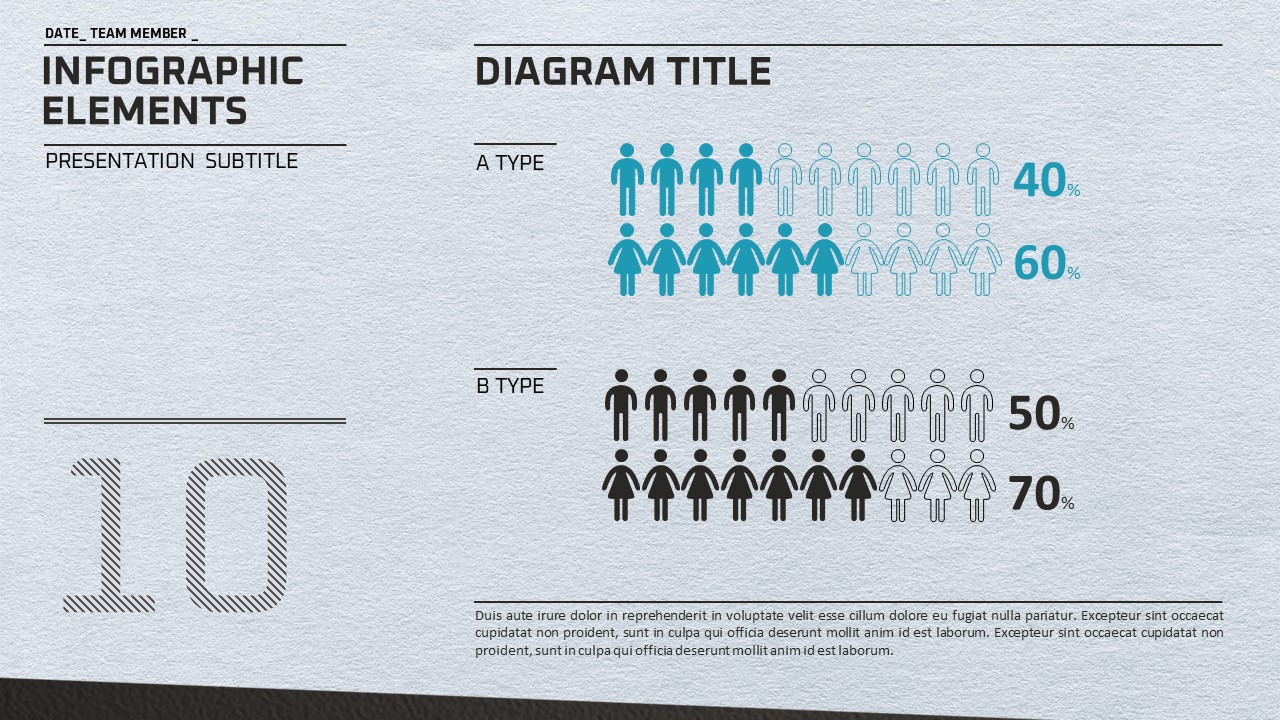
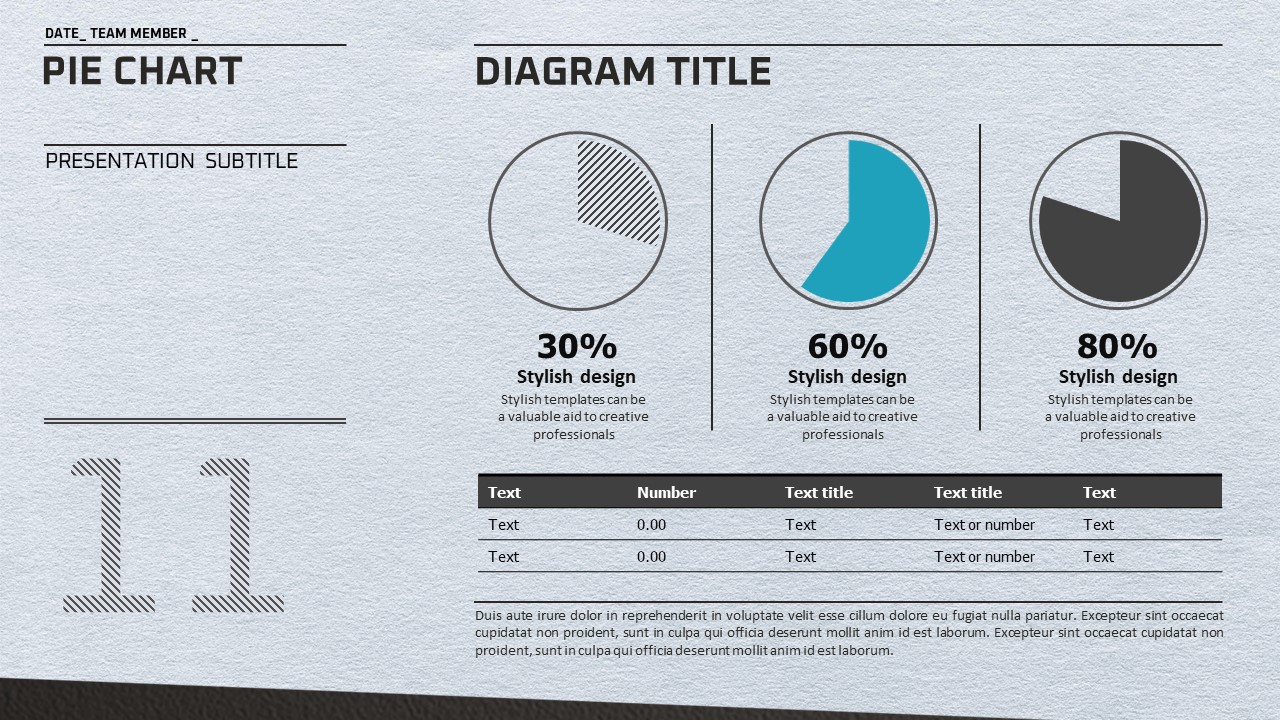
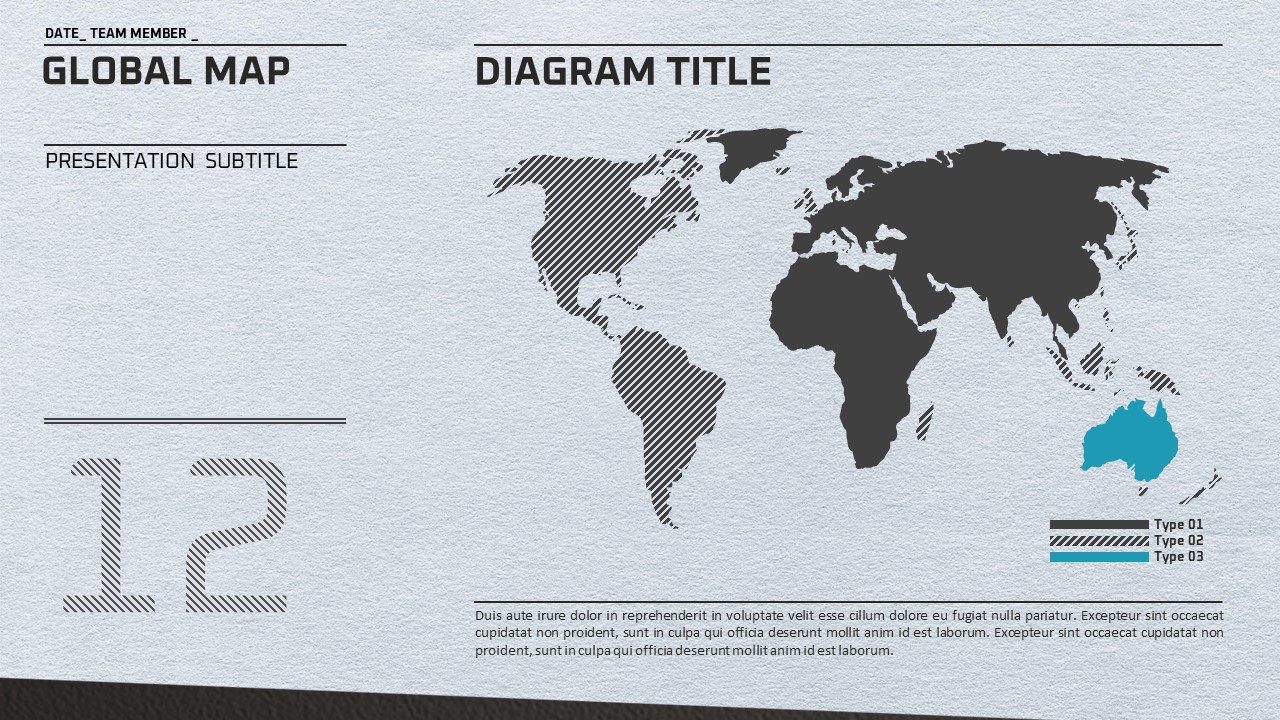
A minimalist business PowerPoint template featuring a light gray textured background, charcoal black typography, and teal accent colors throughout. This 20-slide PPT set covers all the essential slide types needed for professional business presentations: positioning matrix, bubble diagram, bar chart, column chart, pie chart, and a four-icon infographic grid. The grid-based balanced layout allows you to communicate both text and data clearly without visual clutter, while generous white space keeps each slide focused and easy to read. Provided in fully editable PPTX format, every element—text, colors, and chart data—can be customized to match your brand and content. Ideal for strategy reports, market analysis, competitive benchmarking, and performance reviews, this presentation template helps you deliver data-driven insights with a clean, professional look across 20 slides.
Usage Points
-
Main Usage
Designed for strategy reports, market analysis, competitive comparisons, and performance reviews. The 20-slide set provides all the core slide types a business presenter needs, combining data visualization with clean typographic layouts for maximum clarity.
-
How to Use
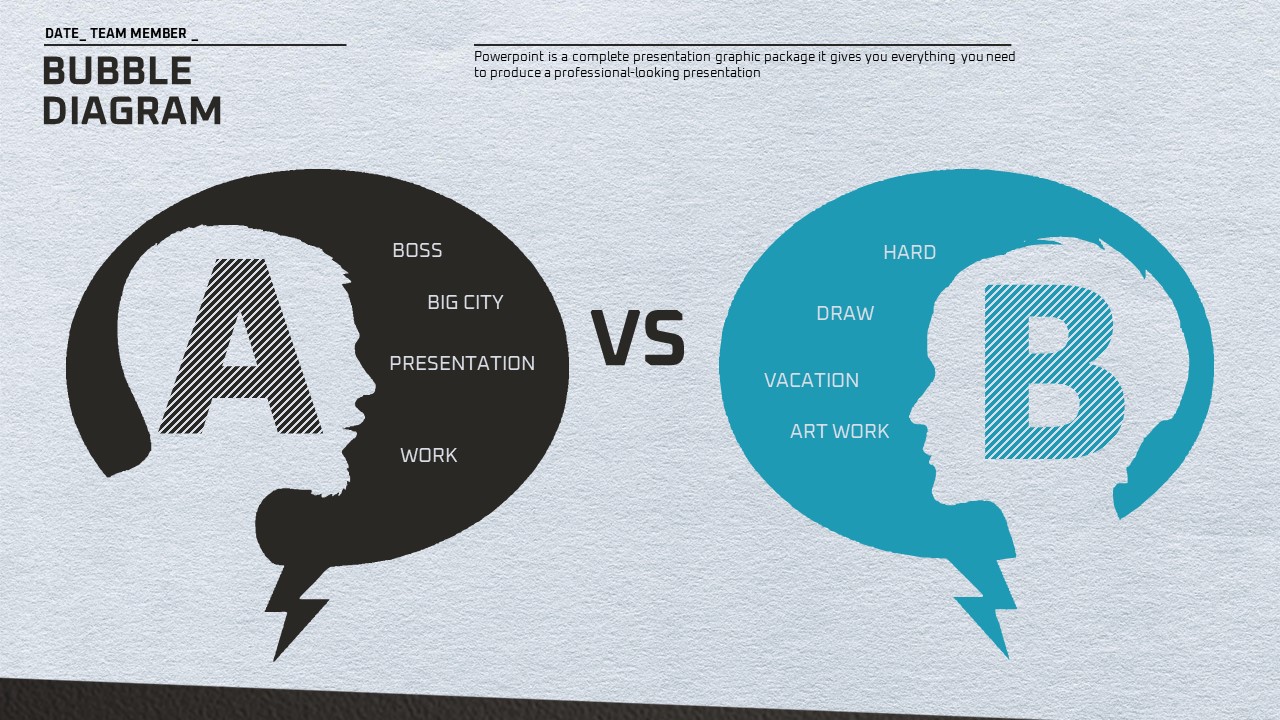
Open the PPTX file and replace placeholder text, numbers, and chart data with your own content. Use the positioning matrix for competitive analysis, the pie and bar charts for performance metrics, and the bubble diagram for A-vs-B comparisons. All colors and fonts are fully editable.
-
Recommended For
Best suited for strategy planners, marketing managers, consultants, and startup founders who regularly prepare data-driven business presentations. Works equally well for investor meetings, internal team briefings, and client proposal sessions.
-
Slide Structure
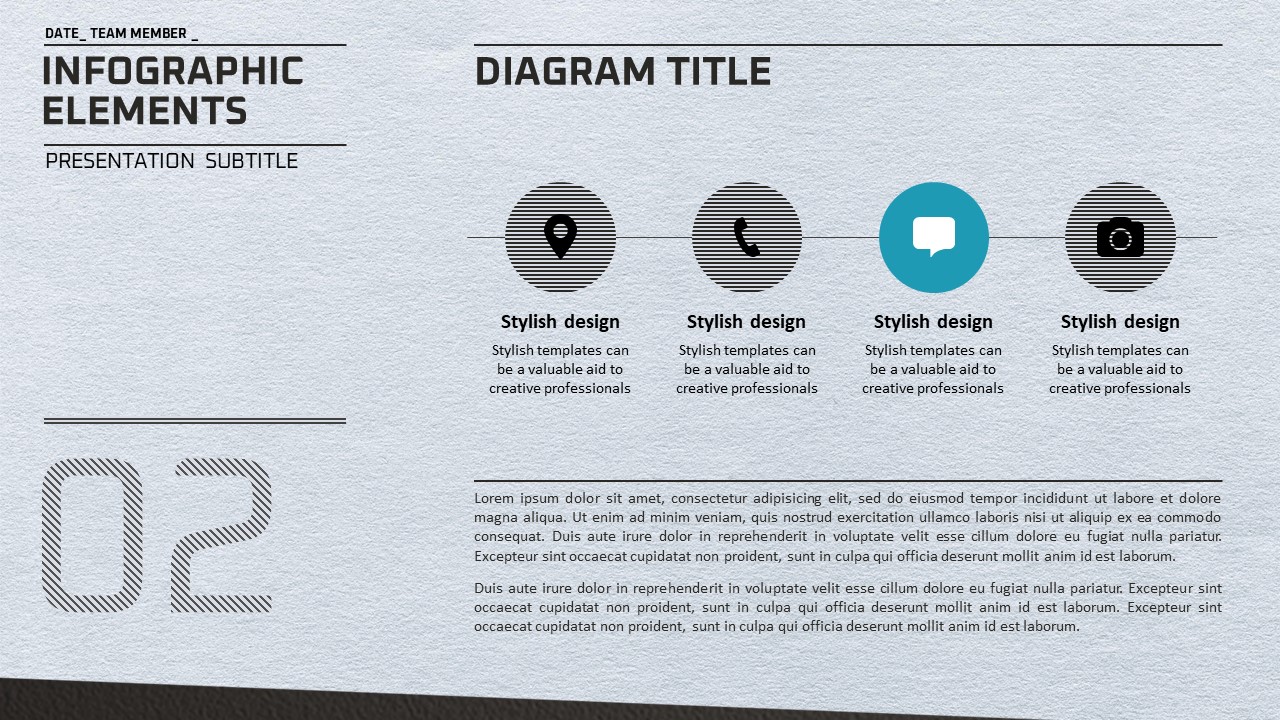
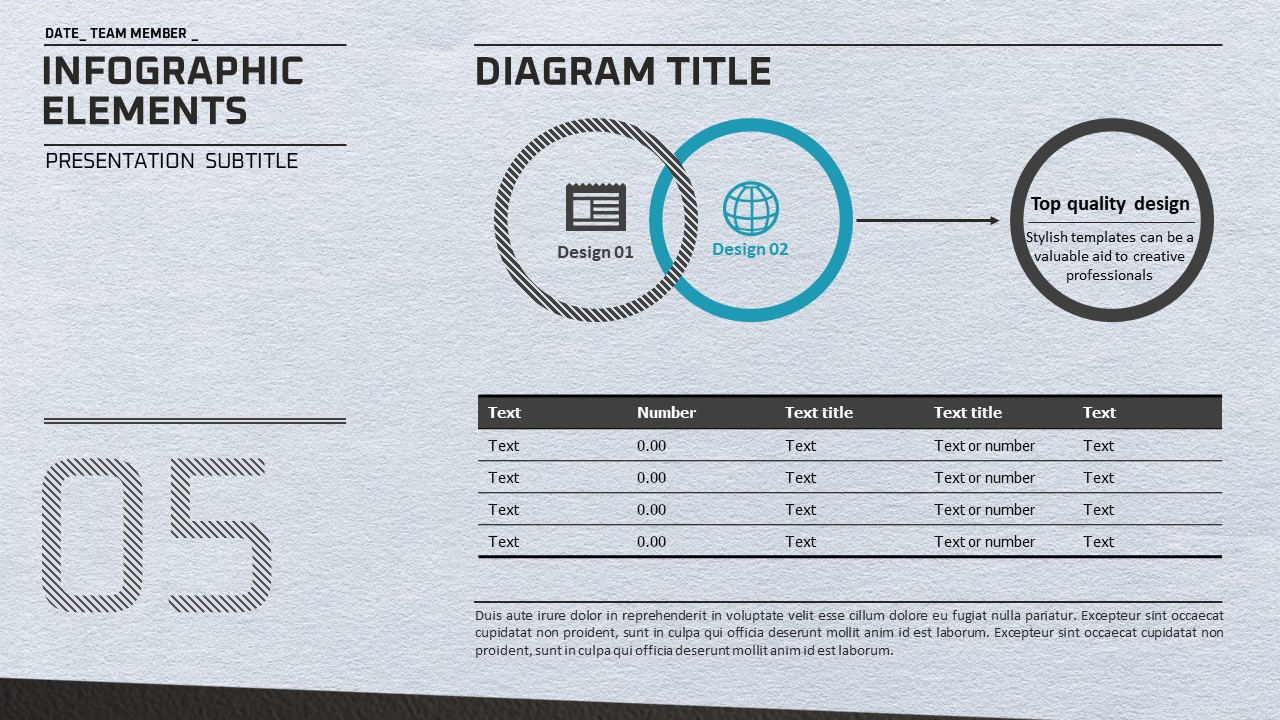
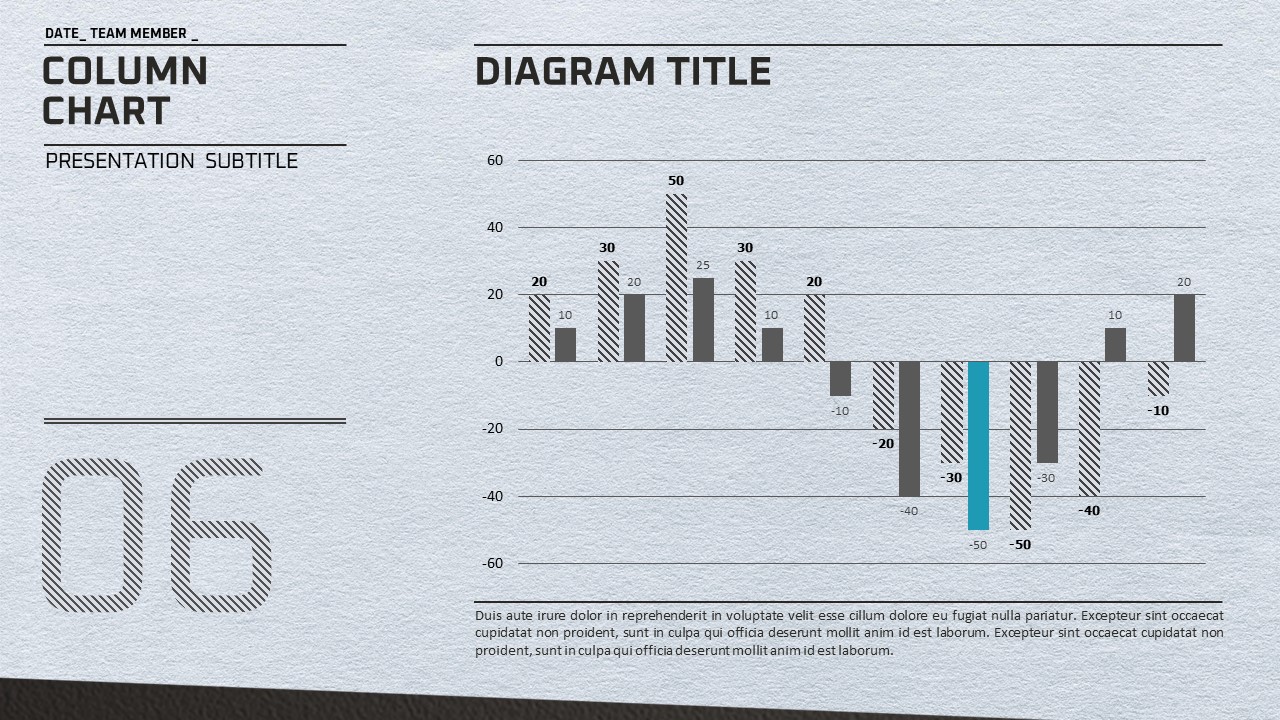
Includes 20 slides: cover slide with bold THINK typography and X·O grid diagram, positioning matrix, infographic elements, column chart, bar chart, bubble diagram (A vs B comparison), four-icon grid layout, and pie chart slides showing 30%, 60%, and 80% data breakdowns.
Related Products
-

Business Work Item Presentation Template – Professional Design
#Business
-

Entertainment Company Presentation Template – Stylish and Colorful Design
#Business
-

Fountain Pen Theme Presentation – Elegant Business Slide Design
#Business
-

Illustrated Folder Presentation Template – Stylish and Practical Design
#Business
