Business Art Overlay Diagram – Marketing Strategy Introduction
RJ0300032_5
- Last Update 04/27/2025
- File Size 5.8MB
- # of Slides 2
- File Format PPTX
- Slide Ratio 16:9
- Color
Keywords
- #Content-Based Slides
- #Design-Based Slides
- #Business Introduction
- #Marketing Plan and Strategy
- #Diagram
- #Business Areas
- #Positioning
- #Cluster
- #Combination Diagram
- #16:9
- #Venn diagram PowerPoint
- #two-circle overlap diagram
- #business art comparison slide
- #intersection analysis diagram
- #PowerPoint diagram slide template
About the Product
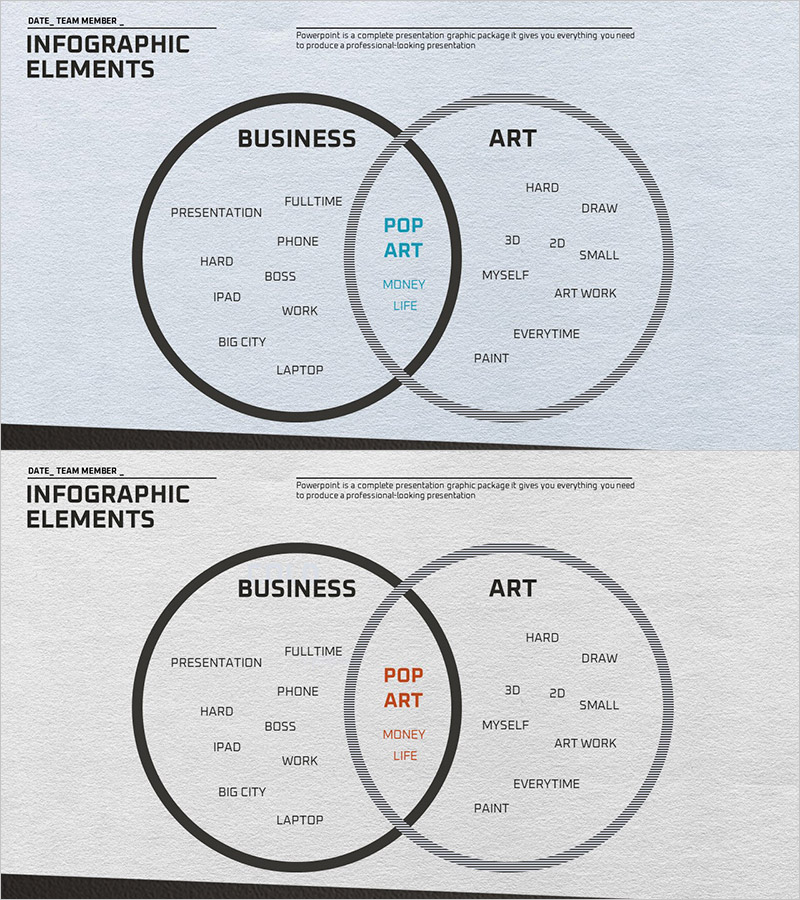
A PowerPoint slide featuring a two-circle Venn diagram that visualizes the intersection between business and art concepts. The design uses a bold black circle on the left and a gray outlined circle on the right, creating a clear overlap area in the center where shared elements can be placed. This diagram is ideal for marketing strategy presentations, organizational culture explanations, job role analysis, and comparative studies that require showing commonalities and differences between two domains. The 16:9 widescreen set includes 2 slides with fully editable text and color options for customization.
Usage Points
-
Main Usage
Effectively compares and analyzes two concepts, domains, or organizational elements by displaying their commonalities and differences in a single visual. Perfect for illustrating relationships between business and creativity, strategy and execution, or any two complementary or contrasting ideas, with the intersection area highlighting key shared values or objectives.
-
How to Use
Insert relevant keywords and concepts into each circle section and the central overlap area. Place business-related items in the left circle, art-related items in the right circle, and shared elements in the center intersection. Customize text size, font, and colors to emphasize importance and create visual hierarchy that guides audience attention to key messages.
-
Recommended For
Marketing strategists, organizational development professionals, business consultants, educators, and team leaders presenting comparative analysis. Suitable for job role clarification, market positioning, organizational culture workshops, learning objective presentations, and any scenario requiring visual comparison of two interconnected concepts.
-
Slide Structure
Two-slide set with color variations: the first slide features blue intersection text, while the second uses orange intersection text for design flexibility. Each slide contains a two-circle Venn diagram with three distinct input areas—left circle, center intersection, and right circle—allowing for balanced information distribution.
Related Products
-

Overlapping Diagram Visualizing Renewable Energy Service Configuration
#Company Introduction #Business Introduction #Diagram
-

Hexagonal Nesting Diagram – Introduce Business Areas and Characteristics
#Product/Service Introduction #Business Introduction #Diagram
-

Business Area Overlay Diagram – A Blend of Visual Appeal and Functionality
#Company Introduction #Business Introduction #Diagram
-

Business Area Circular Nesting Diagram – Cluster Visualization
#Company Introduction #Business Introduction #Diagram
