Competitor Analysis Broken Line Graph – Effective Market Insights
RJ0300032_15
- Last Update 04/26/2025
- File Size 6MB
- # of Slides 2
- File Format PPTX
- Slide Ratio 16:9
- Color
Keywords
About the Product
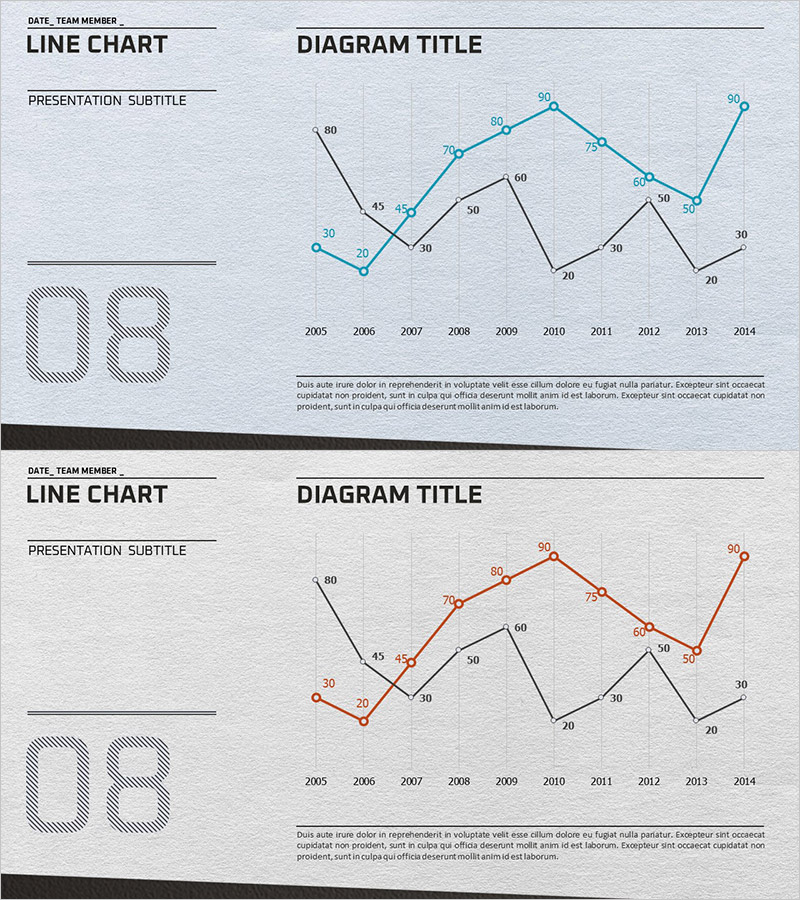
A multi-series line chart PowerPoint slide designed for competitor analysis and market insights. This presentation template visualizes 10-year data trends (2005–2014) across three distinct series using cyan, black, and orange lines for clear differentiation. The grid background and labeled data points enable precise value reading, making it ideal for reports, business presentations, and analytical documents. The 2-slide set accommodates various trend visualization scenarios with editable data fields.
Usage Points
-
Main Usage
Visualize annual trends, competitor comparisons, and market changes through multi-series line data. This chart enables simultaneous display of multiple data series to identify patterns and derive actionable insights. Perfect for executive presentations, quarterly reports, and strategic analysis documents.
-
How to Use
Input actual data values to update line positions and numeric labels on the slide. Customize series colors to represent different organizations, competitors, or categories. Edit axis labels, legend text, and chart title to match your presentation context. Toggle grid lines and data point markers as needed for clarity.
-
Recommended For
Financial analysts, marketing managers, executives, consultants, and researchers presenting market trends, sales performance, competitive positioning, and performance metrics. Suitable for quarterly/annual comparisons, industry benchmarking, customer satisfaction tracking, and multi-variable performance analysis.
-
Slide Structure
2-slide set featuring three-line series in cyan, black, and orange. Each slide displays approximately 10 data points spanning 2005–2014, with complete chart elements including grid background, axis labels, legend, title area, and subtitle section for comprehensive data presentation.
Related Products
-

Black Navy Broken Line Graph Table – Market and Competitor Analysis
#Market and Competitor Analysis #Diagram #Graph
-

Project Market Environment Analysis Chart – Powerful Competitive Strategy
#Market and Competitor Analysis #Graph #Competitor Analysis
-

Data Analysis Graph Visualization for Market Competition
#Market and Competitor Analysis #Diagram #Graph
-

Competitor Technology Comparison Graph – Market and Competitor Analysis
#Market and Competitor Analysis #Graph #Competitor Analysis
