Market Analysis Vertical Bar Graph – Strengthening Competitiveness
RJ0300032_13
- Last Update 04/26/2025
- File Size 5.8MB
- # of Slides 2
- File Format PPTX
- Slide Ratio 16:9
- Color
Keywords
- #Content-Based Slides
- #Design-Based Slides
- #Market and Competitor Analysis
- #Graph
- #Competitor Analysis
- #Market Analysis
- #Column
- #Grouped Column
- #16:9
- #vertical bar chart PowerPoint
- #positive negative graph template
- #market analysis slide
- #competitor comparison chart
- #waterfall chart PPT
- #data visualization slide template
About the Product
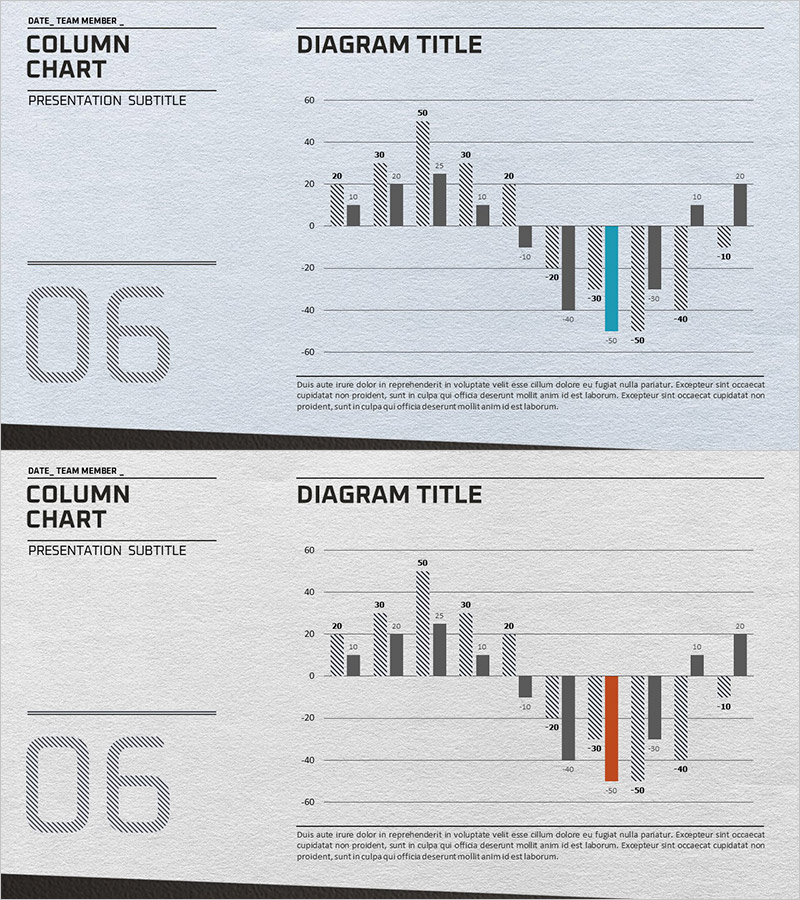
A two-slide vertical bar chart PowerPoint template optimized for market analysis and competitive assessment. This waterfall-style bar graph simultaneously displays positive and negative values, enabling intuitive visualization of competitor comparison, performance analysis, and trend changes. The combination of diagonal-pattern and solid bars with accent colors (cyan and orange) enhances presentation credibility and highlights key metrics. Available in 16:9 widescreen PPTX format, fully editable with customizable numbers, labels, and legends for immediate use.
Usage Points
-
Main Usage
Designed for market analysis reports, competitor analysis, and performance evaluation presentations where simultaneous comparison of positive and negative data and clear expression of trend changes are essential. The waterfall-style bar graph enables step-by-step explanation of complex data structures.
-
How to Use
The two slides feature different color accents (cyan and orange) allowing comparison of multiple metrics or scenarios. Edit numbers, labels, and axis ranges to input actual data, then modify legends and titles to match your presentation context and audience needs.
-
Recommended For
Ideal for executives, marketing teams, strategic planning departments, and finance teams presenting quarterly performance, market share changes, competitor benchmarking, and cost variance analysis. Suitable for business plans, marketing strategies, investor pitch decks, and management reports.
-
Slide Structure
Each slide features a vertical bar chart centered on the Y-axis zero line, with positive values extending upward and negative values downward. Approximately 8-10 bars are represented using diagonal patterns, solid colors, and accent highlights, with numerical labels displayed above each bar. Legend and title areas are positioned on the left, with descriptive text space at the bottom.
Related Products
-

Grouped Bar Chart for Learning Categories
#Market and Competitor Analysis #Graph #Competitor Analysis
-

Marketing and Analysis Presentation Template – Professional Data Visualization Design
#Market and Competitor Analysis #Graph #Competitor Analysis
-

Vertical Bar Chart Slide for Effective Data Visualization
#Market and Competitor Analysis #Graph #Competitor Analysis
-

Pill Market Analysis Vertical Bar Graph – Clear Visualization of Market Status
#Market and Competitor Analysis #Graph #Competitor Analysis
