Marketing Strategy & Table of Contents – Cluster Design for Data Visualization
RJ0300032_12
- Last Update 04/26/2025
- File Size 6MB
- # of Slides 2
- File Format PPTX
- Slide Ratio 16:9
- Color
Keywords
- #Content-Based Slides
- #Design-Based Slides
- #Business Vision and Strategy
- #Marketing Plan and Strategy
- #Diagram
- #Business Strategy
- #Marketing Strategy
- #Cluster
- #Table
- #Chain Diagram
- #Standard Table
- #16:9
- #cluster diagram PowerPoint
- #marketing strategy presentation slide
- #3-node relationship diagram
- #data visualization template
- #table diagram PowerPoint template
About the Product
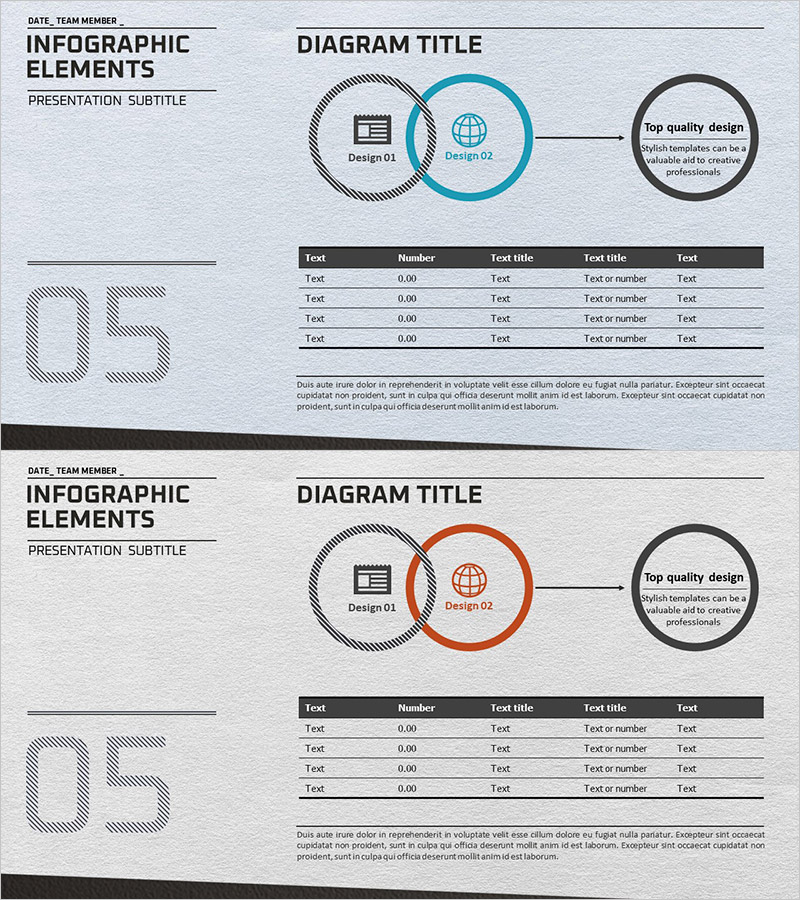
A professional cluster diagram PowerPoint slide optimized for marketing strategy and business planning presentations. The design features a central hub concept connected to three peripheral elements, enabling intuitive visualization of strategic relationships and data connections. The layout combines a gray hatched background with blue and orange accent circular nodes to clearly distinguish information hierarchy. Paired with a data table below, this slide supports numerical analysis and decision-making. The 2-slide set is ready for immediate application across diverse marketing scenarios and strategic presentations.
Usage Points
-
Main Usage
Designed to visually represent the relationship between a core concept and surrounding elements in marketing strategy, business planning, and product positioning. The three-directional radial structure from the central node clearly communicates strategic hierarchy and interconnections.
-
How to Use
Enter your core strategy in the central circular node and add detailed strategies, objectives, or implementation plans in the three surrounding nodes. Populate the data table below with metrics, timelines, and responsibility assignments to present concrete execution plans. Customize colors and icons by category to adapt the diagram to various marketing scenarios.
-
Recommended For
Ideal for marketing managers, strategic planning teams, business development professionals, and executive presentations. Perfect for marketing planning documents, business plans, product launch presentations, and quarterly strategy reports where complex relationships need clear, concise visual communication.
-
Slide Structure
Slide 1: Central blue circular node (Design 02) connected to a left gray hatched node (Design 01) and right black node in a 3-node cluster configuration. Slide 2: Identical diagram structure with orange accent node applied. Data table below features 5 columns (Text, Number, Text title, Text title, Text) and 4 rows for numerical information input.
Related Products
-

International Trade Business Strategy Diagram – Global Business Growth
#Business Vision and Strategy #Marketing Plan and Strategy #Diagram
-

Business Strategy Silhouette Diagram
#Business Vision and Strategy #Marketing Plan and Strategy #Diagram
-

Business Objectives Analysis Table Diagram – Analyze All Business Goals
#Business Vision and Strategy #Diagram #Business Strategy
-

Strategy and Direction Diagram – Business Vision and Marketing Strategy
#Business Vision and Strategy #Marketing Plan and Strategy #Diagram
