Customer Analysis Gender Ratio Analysis Graph - Key to Market Understanding
RJ0300032_17
- Last Update 04/27/2025
- File Size 6MB
- # of Slides 2
- File Format PPTX
- Slide Ratio 16:9
- Color
Keywords
About the Product
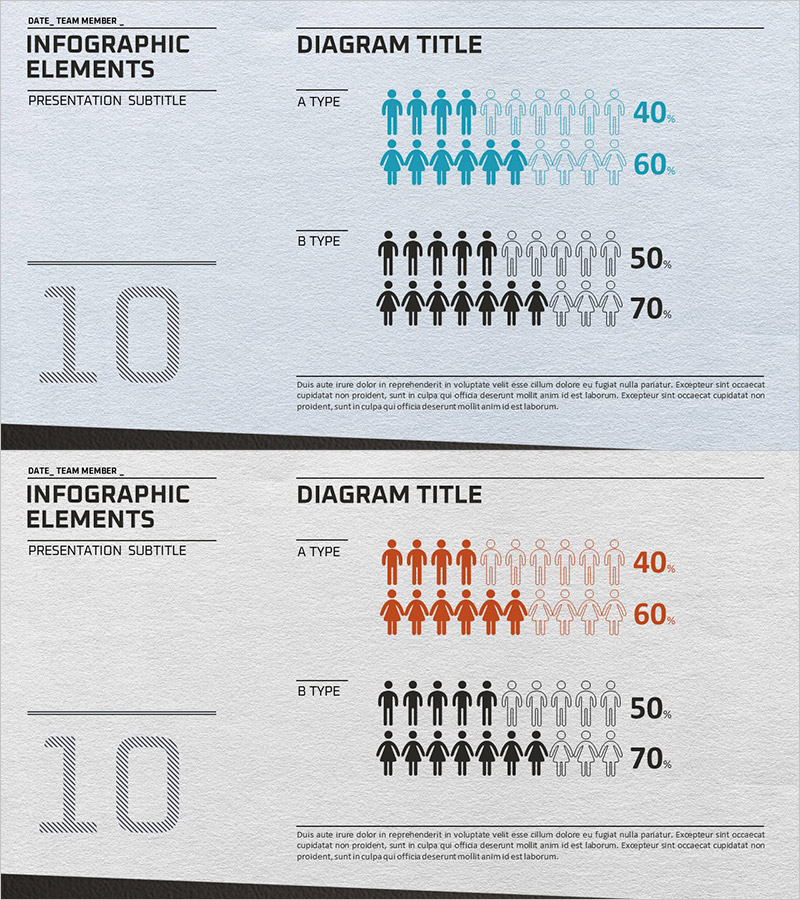
A professional PowerPoint slide for customer analysis and market understanding featuring gender ratio visualization. The design uses teal and black human icons to display four distinct data configurations: A Type (40%, 60%) and B Type (50%, 70%) in a comparative layout. Formatted in 16:9 aspect ratio across 2 slides, each dataset employs filled and outlined icons to intuitively represent proportional relationships. The slide template is ready for immediate use in business reports, marketing plans, and market analysis presentations.
Usage Points
-
Main Usage
Clearly visualize customer segment gender composition ratios to support market analysis and target audience understanding. The human icon-based design enables executives and team members to quickly grasp data insights without extensive explanation.
-
How to Use
Integrate into business reports' customer analysis sections, marketing plans' target market analysis, and investor pitch decks' market overview slides. Use individual data sets independently or arrange both slides sequentially to enhance comparative analysis impact.
-
Recommended For
Marketing professionals, business planning teams, market research analysts, and executives preparing presentation materials. Ideal for any situation requiring gender-based customer segmentation, demographic analysis, or market composition ratio explanation.
-
Slide Structure
2-slide set. Each slide contains 2 data configurations (A Type and B Type), with each set using filled human icons (teal/black) and outlined icons to represent proportions. Numerical labels (40, 60, 50, 70) positioned on the right ensure precise data communication.
Related Products
-

Global User Analysis Map Graph
#Company Introduction #Market and Competitor Analysis #Graph
-

User Analysis Pictogram Graph – Visualizing Customer Success
#Market and Competitor Analysis #Customer Success Stories #Graph
-

Global User Status Analysis Graph – Data Visualization
#Market and Competitor Analysis #Graph #Other
-

Premium Management Presentation Map Analysis3 - Customer Insights and Market Analysis
#Market and Competitor Analysis #Graph #Other
