A vs B Diagram for Competitive Advantage Analysis
RJ0300032_7
- Last Update 04/27/2025
- File Size 6MB
- # of Slides 2
- File Format PPTX
- Slide Ratio 16:9
- Color
Keywords
About the Product
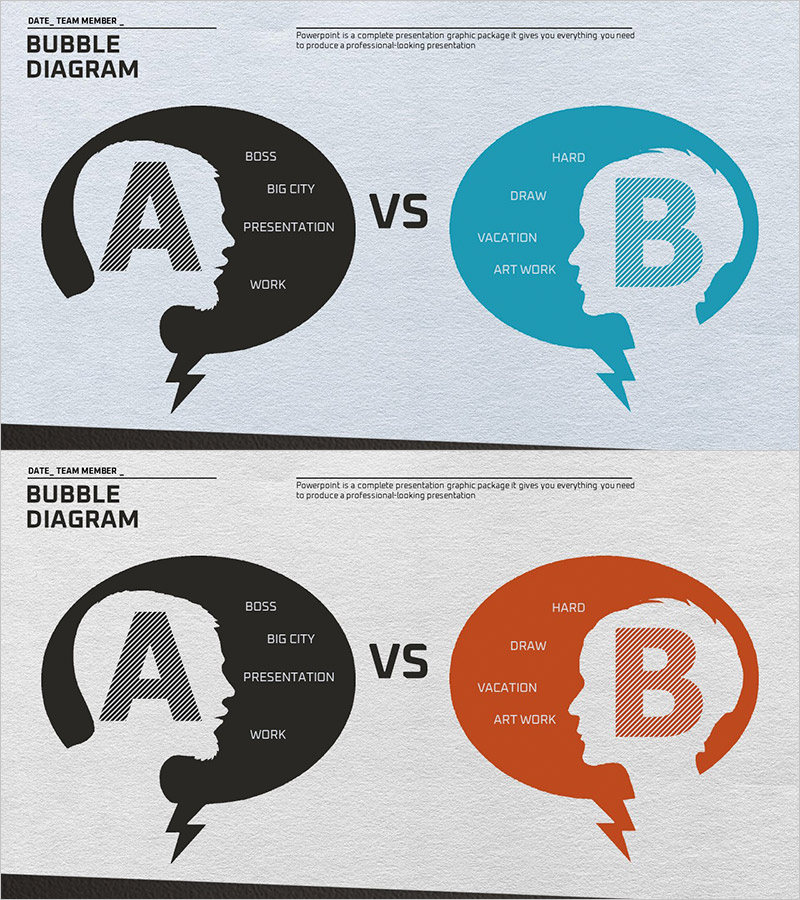
A vs B comparison diagram PowerPoint slide that visually contrasts two concepts, products, or teams using silhouette head shapes in black and teal (or orange) colors. Each silhouette contains text fields for inputting distinctive characteristics, with a central 'VS' text emphasizing the competitive or comparative relationship. The 2-slide set offers flexible color combinations and is optimized for 16:9 widescreen format. Instantly applicable to business presentations including competitive analysis, product positioning, team comparison, and strategic planning.
Usage Points
-
Main Usage
Visually contrast two subjects (competitors, products, teams, strategies) to present decision-making evidence. The silhouette-based design enables intuitive expression of abstract concepts while creating a striking comparison structure that captures audience attention.
-
How to Use
Input characteristics, advantages, and roles of comparison subjects into the text fields within each silhouette. Use during business strategy presentations, competitive analysis, product positioning, and team role explanations. Modify colors to represent various comparison scenarios.
-
Recommended For
Ideal for executives, marketing teams, strategic planners, and sales professionals explaining competitive analysis, product differentiation, and team responsibilities. Suitable for investment pitch decks, business proposals, strategy meetings, and product launch presentations.
-
Slide Structure
2-slide set with two silhouettes (black and teal/orange) per slide. Each silhouette contains 4-5 text input areas for hierarchically entering comparative characteristics, with a central 'VS' text emphasizing the contrast relationship.
Related Products
-

Zombie Walking Dead Slide – Optimized for Competitor Analysis with Doughnut Chart
#Market and Competitor Analysis #Graph #Other
-

Vertical Bar Chart Slide for Business Competitive Advantage Analysis
#Market and Competitor Analysis #Graph #Other
-

Broken Line Competitive Advantage Analysis – Market and Competitor Insights
#Market and Competitor Analysis #Graph #Competitor Analysis
-

Bar Chart Visualizing Steak Consumption
#Business Strategy #Market and Competitor Analysis #Graph
