Global Target Area Map for Market Analysis Slides
RJ0300032_19
- Last Update 04/27/2025
- File Size 6MB
- # of Slides 2
- File Format PPTX
- Slide Ratio 16:9
- Color
Keywords
About the Product
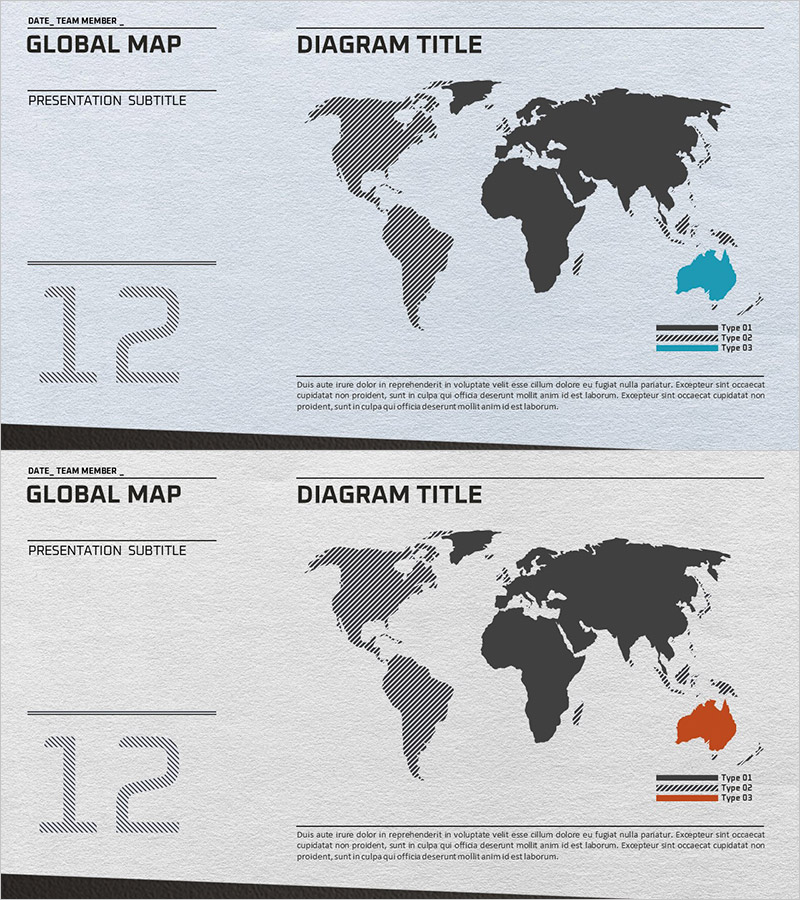
A free PowerPoint slide optimized for global market analysis and target region visualization. This slide features a world map base structure that allows you to highlight up to three regions in different colors, with a left-side information panel for titles, subtitles, and numerical data. Simply replace the text and you can instantly insert this slide into business plans, investor presentations, marketing proposals, and other presentation materials. With low editing difficulty, even beginners can easily customize it. Perfect for expressing global networks, international market expansion, regional performance analysis, and other business scenarios that require geographic visualization.
Usage Points
-
Main Usage
Visualize global market analysis, target regions, and international business scope. The slide allows you to highlight up to three regions in different colors on a world map, making it easy to communicate market distribution, expansion territories, and customer demographics at a glance.
-
How to Use
Enter your presentation content in the left-side title, subtitle, and data fields. Select the regions you want to highlight on the map and apply colors. Use the legend to clarify what each region represents, and add supplementary information in the bottom text area. You can express different scenarios by changing colors.
-
Recommended For
Executives and planners developing global business strategies, startup founders and corporate representatives presenting international expansion plans to investors, marketing teams visualizing regional target markets, and professionals reporting on international business performance.
-
Slide Structure
Single-slide composition with four data input areas on the left (title, subtitle, and numerical fields), a world map with three region-highlighting areas on the right, and a description text field at the bottom. Light gray background with dark gray/black base map and color-highlighted regions create clear visual hierarchy.


