
Blossom Cosmetic PowerPoint Template – Stylish Design with Fresh Colors
J0800028
- Last Update 01/19/2025
- File Size 39.2MB
- # of Slides 30
- File Format PPTX
- Slide Ratio 16:9
- Color
Slide Preview


Keywords
About the Product
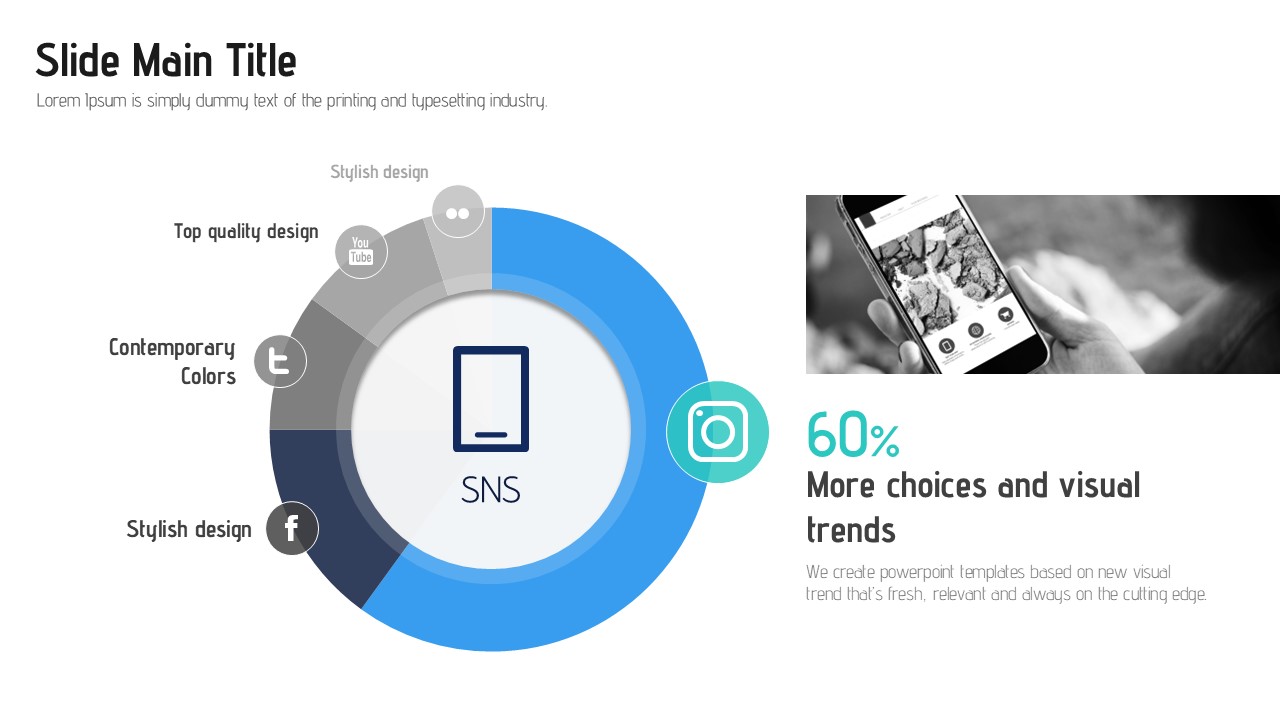
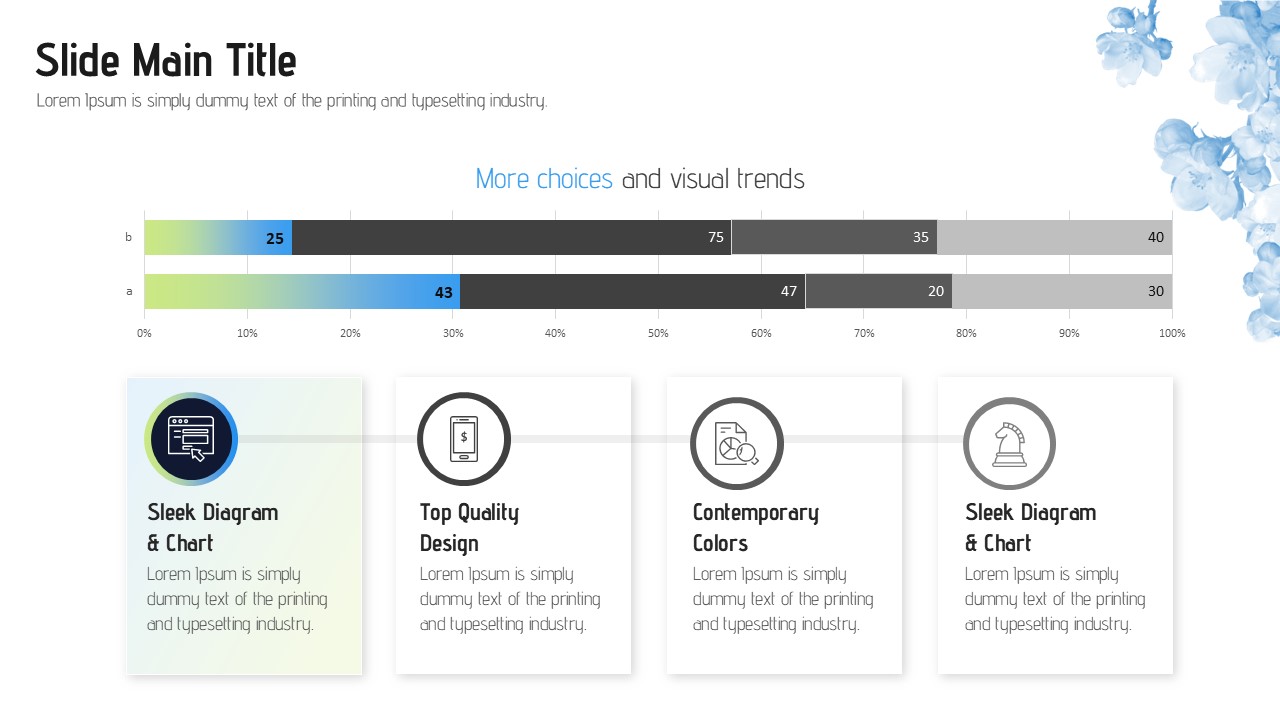
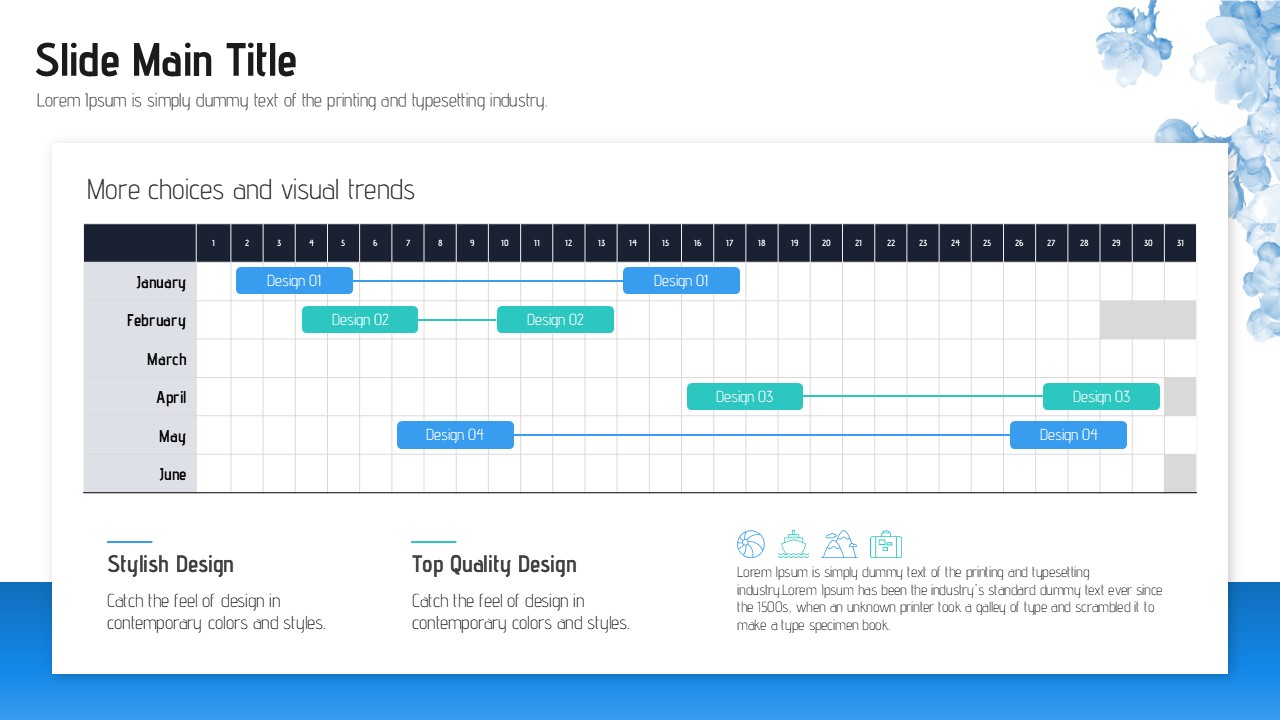
This PowerPoint template is designed specifically for cosmetic and beauty brand presentations, featuring a vivid blue background layered with a soft watercolor floral pattern. The cover slide showcases cosmetic product silhouettes for instant industry recognition, while the deck alternates between clean white-based slides and deep blue gradient slides to create visual rhythm throughout your presentation. The 30-slide PPTX set includes a wide range of data visualization slides — circular donut charts, world map bubble charts, bar graphs, and line graphs with data tables — making it easy to communicate market analysis, sales trends, and global performance. All text, colors, and figures are fully editable, so you can adapt this presentation template to fit your brand identity and deliver a polished, professional slide deck for product launches, investor pitches, or brand strategy sessions.
Usage Points
-
Main Usage
Ideal for cosmetic and beauty brand presentations including product launches, market analysis reports, brand strategy decks, and investor pitches. The blue watercolor floral design conveys freshness and brand sophistication suited to the beauty industry.
-
How to Use
Open the PPTX file and replace placeholder text, figures, and colors with your brand content. Alternate between the light white-based slides and deep blue gradient slides to maintain visual flow and keep your audience engaged throughout the presentation.
-
Recommended For
Best suited for beauty brand marketers, product planners, cosmetic startup founders preparing investor decks, and beauty industry professionals who need to present global market data or brand performance in a visually compelling slide format.
-
Slide Structure
The 30-slide set includes a cover slide with product silhouettes on a vivid blue background, circular and donut chart slides, four-panel icon card slides, a world map bubble chart, year-over-year bar graph slides (2026–2030), and a line graph with a data comparison table on a dark blue background.
Related Products
-

Suit Presentation Template – Elegant Design and Practicality
#Other
-

Nature Beauty PPT Wide – Refreshing Design Capturing Nature for Your Presentations
#Other
-

Workout PPT Wide – Stylish Presentation Template Focused on Fitness
#Other
-

Food Truck Presentation Template – Eye-Catching Design to Grab Attention
#Other
