Data Trends Visualized through Diagrams – Vision and Innovation
RJ0800028_18
- Last Update 08/07/2025
- File Size 2.7MB
- # of Slides 2
- File Format PPTX
- Slide Ratio 16:9
- Color
Keywords
About the Product
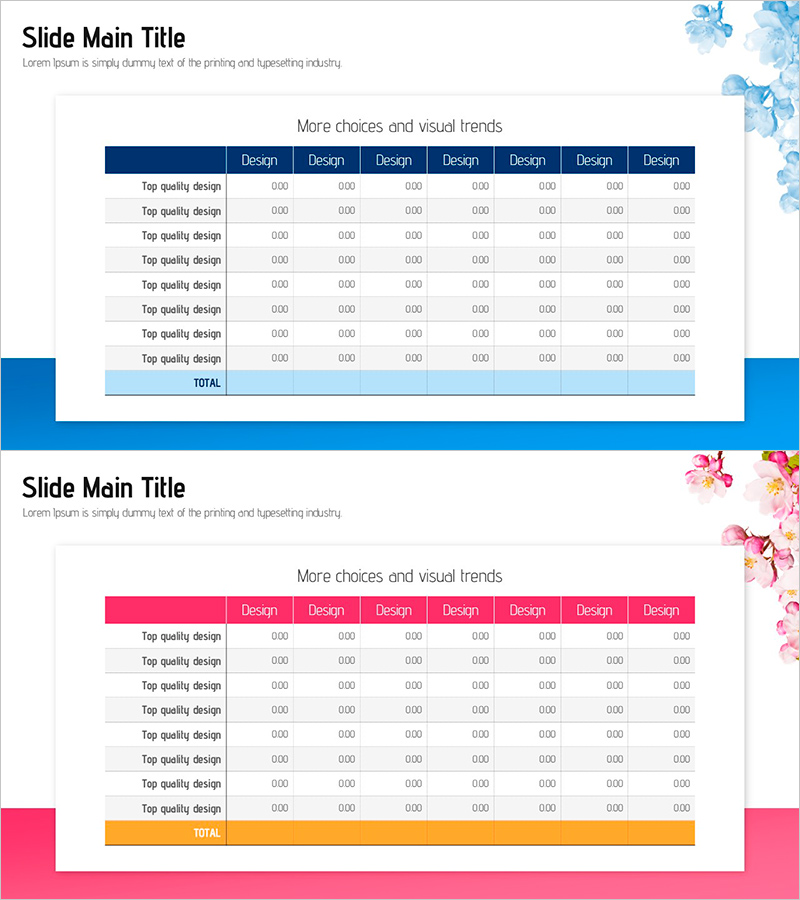
A 2-slide PowerPoint presentation featuring table-format diagrams for visualizing data trends and comparative analysis. Available in two color schemes—navy blue and hot pink—each slide provides an 8-column structure for comparing design options, performance metrics, or market data at a glance. The header row uses bold color blocks, while data cells are ready for numerical input. Decorative floral illustrations in the top-right corner and colored accent blocks on the left side create visual balance. Ideal for business reports, marketing analysis presentations, strategy reviews, and any data-driven decision-making scenario requiring clear side-by-side comparison.
Usage Points
-
Main Usage
Organize and compare multiple design options, product features, market data, or performance indicators in a structured row-and-column format. Audiences quickly grasp data patterns and relationships when information is presented in a clear tabular layout with color-coded headers.
-
How to Use
Enter numerical data or text into each cell to customize the slides. Use the navy blue version for corporate reports and technical presentations; use the hot pink version for marketing and creative strategy pitches. Colors, fonts, and cell borders are fully editable in PowerPoint.
-
Recommended For
Financial analysts, marketing managers, project managers, consultants, and business strategists who present data-driven insights. Suitable for quarterly performance reviews, competitive analysis, product option comparisons, market research findings, and executive dashboards.
-
Slide Structure
2-slide set. Slide 1 features a navy blue header with 8 data-entry columns, blue floral accent in top-right, and left-side color block. Slide 2 mirrors the layout with a hot pink header, pink floral illustration, and matching color block. Both slides maintain consistent grid structure for seamless data input and professional appearance.
Related Products
-

The Road Template Diffusion Diagram – Product and Service Differentiation Strategy
#Product/Service Introduction #Business Vision and Strategy #Diagram
-

Business Forest Wide Template Diagram2 – Flowchart for Market Strategy
#Marketing Plan and Strategy #Diagram #Target Market Strategy
-

Road Template Diagram7 – Business Area and Strategy
#Business Introduction #Business Strategy #Diagram
-

Idea Presentation Diagram – Business Execution and Strategic Vision
#Business Strategy #Operational Plan #Marketing Plan and Strategy
