Visualizing Profit Outlook with Development and Growth Graphs
RJ0800028_15
- Last Update 08/07/2025
- File Size 2.9MB
- # of Slides 2
- File Format PPTX
- Slide Ratio 16:9
- Color
Keywords
- #Content-Based Slides
- #Design-Based Slides
- #Business Strategy
- #Market and Competitor Analysis
- #Graph
- #Other
- #Financial Outlook & Expected Impact
- #Future Outlook
- #16:9
- #revenue outlook chart PowerPoint
- #growth graph slide
- #bar and line chart PPT
- #business performance presentation slide
- #data visualization PowerPoint template
About the Product
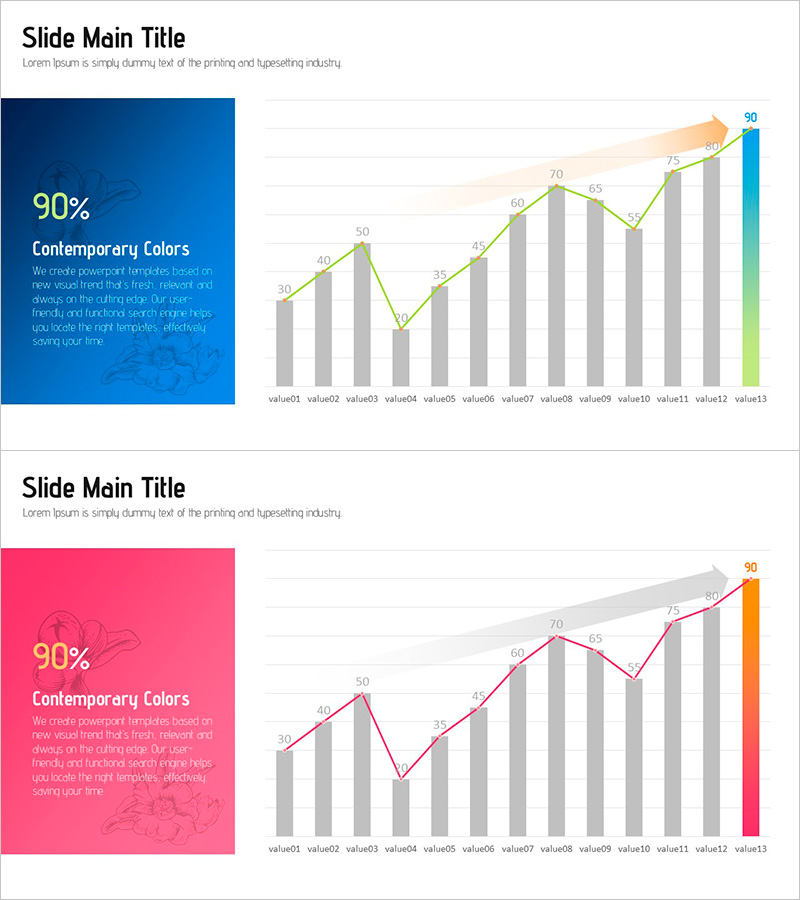
A PowerPoint slide that visualizes development and growth trends using both bar and line charts simultaneously. The 2-slide set features a color-coded text box on the left for title and description, with 13 data points displayed on the right. Blue, pink, and gray gradient tones emphasize data progression, making it ideal for revenue forecasts, market analysis, and business performance presentations. Delivered in 16:9 widescreen PPTX format for seamless compatibility across all presentation environments.
Usage Points
-
Main Usage
Compare quarterly or annual revenue trends, market growth rates, and business performance metrics at a glance. The bar graph displays absolute values while the line chart emphasizes trends, providing clear decision-making evidence.
-
How to Use
Enter section title (e.g., Revenue Outlook, Market Growth) and descriptive text in the left color box. Replace the 13 data points on the right chart with actual figures for automatic reflection. Place in IR materials, business plans, or quarterly reports to highlight financial performance sections.
-
Recommended For
CFOs, finance managers, and business development teams presenting revenue trends and growth forecasts to investors, executives, and partners. Particularly effective for startup pitch decks, corporate earnings presentations, and strategic planning meetings.
-
Slide Structure
2-slide set: Slide 1 features blue-toned background with 13-point dual bar and line chart; Slide 2 uses pink-toned background with identical chart structure. Each slide separates left text area (title and description) from right chart area, creating clear information hierarchy.
Related Products
-

Food Truck Sales Rise Graph - Strong Business Strategy
#Business Strategy #Market and Competitor Analysis #Diagram
-

Analyzing Bank Delinquency Rate Trends with Stacked Area Chart
#Business Strategy #Market and Competitor Analysis #Graph
-

Visualizing the Changing Trend of the Ageing Population with a 100% Stacked Bar Graph
#Business Strategy #Market and Competitor Analysis #Marketing Plan and Strategy
-

Growth Curve Area Graph - Market and Competitive Analysis
#Business Strategy #Market and Competitor Analysis #Graph
