Infrastructure and Regional Marketing Strategies – Data Visualization Template
RJ0800028_26
- Last Update 08/07/2025
- File Size 3MB
- # of Slides 2
- File Format PPTX
- Slide Ratio 16:9
- Color
Keywords
- #Content-Based Slides
- #Design-Based Slides
- #Company Introduction
- #Business Introduction
- #Graph
- #Other
- #Domestic Network
- #Infrastructure
- #Column
- #Grouped Column
- #Map
- #16:9
- #world map PowerPoint slide
- #regional marketing presentation
- #network diagram slide
- #geographic data visualization
- #bar chart PPT template
About the Product
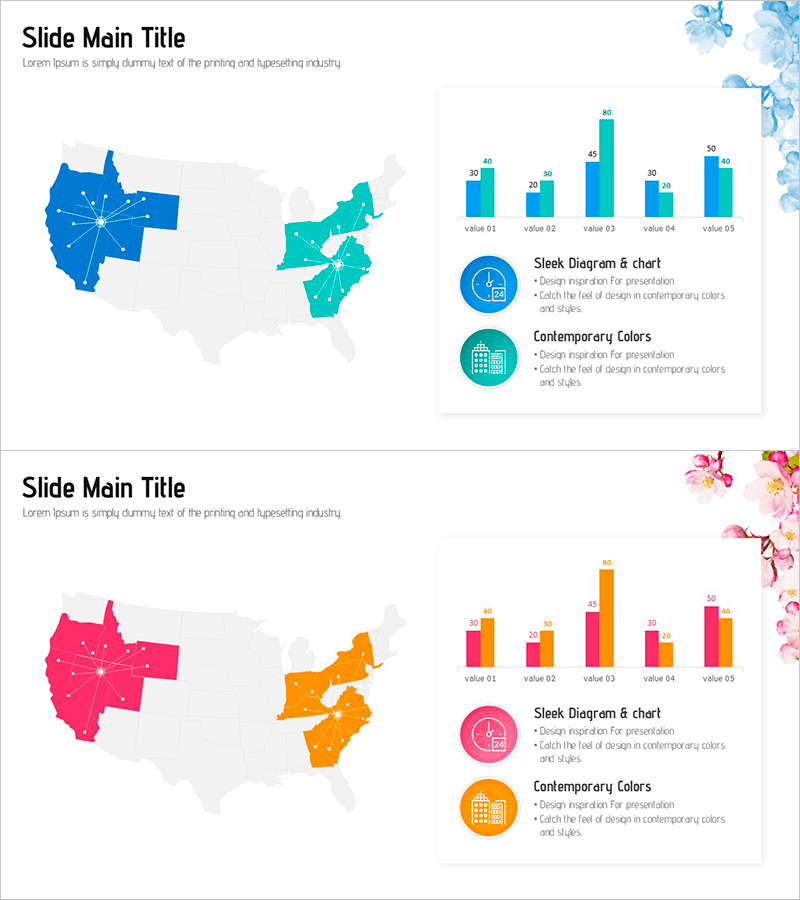
A comprehensive PowerPoint slide set for visualizing global infrastructure and regional marketing strategies. The first slide features a world map in blue and teal tones with network nodes and connection lines, illustrating global infrastructure structure and international partnerships at a glance. The second slide combines a world map in pink and orange tones with five-item horizontal and vertical bar charts, enabling comparative analysis of regional marketing performance metrics. Both slides include icons and text descriptions for immediate presentation use, with fully editable colors, data values, and layout elements.
Usage Points
-
Main Usage
Simultaneously visualize global infrastructure structure and regional marketing performance through integrated data visualization. Network nodes on the world map represent international hubs, supply chains, and partnerships, while bar charts compare quantitative metrics such as regional sales volume, market share, and growth rates. Ideal for executive briefings, investor pitches, and strategic planning meetings requiring global perspective.
-
How to Use
Click and customize the world map and network nodes on the first slide to adjust colors, sizes, and positions; enter region and hub names in text boxes. Double-click the bar chart data on the second slide to modify values, and the chart automatically updates. Add or remove icons and legends as needed, and freely customize background colors and fonts to match your brand guidelines.
-
Recommended For
Recommended for executives, marketing managers, and strategic planning teams preparing global business strategies, regional marketing initiatives, supply chain management, and international sales reports. Ideal for multinational corporations presenting quarterly and annual performance results, new market entry plans, and regional performance analysis presentations.
-
Slide Structure
Slide 1: Blue and teal world map with 5 regional network nodes, connection lines, 2 icons, and text descriptions. Slide 2: Pink and orange world map with 5-item horizontal bar chart (Value 01–05, max 80) and 5-item vertical bar chart (Value 01–05, max 50), 2 icons, and text descriptions. 16:9 widescreen format, PPTX file.
Related Products
-

Graph of Analysis by Year in the Americas – Infrastructure and Business Strategy
#Company Introduction #Business Introduction #Graph
-

Visualizing Local Routes in a Business Diagram
#Company Introduction #Business Introduction #Diagram
-

Cluster Diagram Visualizing Korea's Network
#Company Introduction #Business Introduction #Diagram
-

Regional Distribution Chart for Global Marketing Strategy
#Company Introduction #Marketing Plan and Strategy #Other
