Cosmetics Business System and Performance – Key to Success
RJ0800028_23
- Last Update 08/07/2025
- File Size 2.7MB
- # of Slides 2
- File Format PPTX
- Slide Ratio 16:9
- Color
Keywords
About the Product
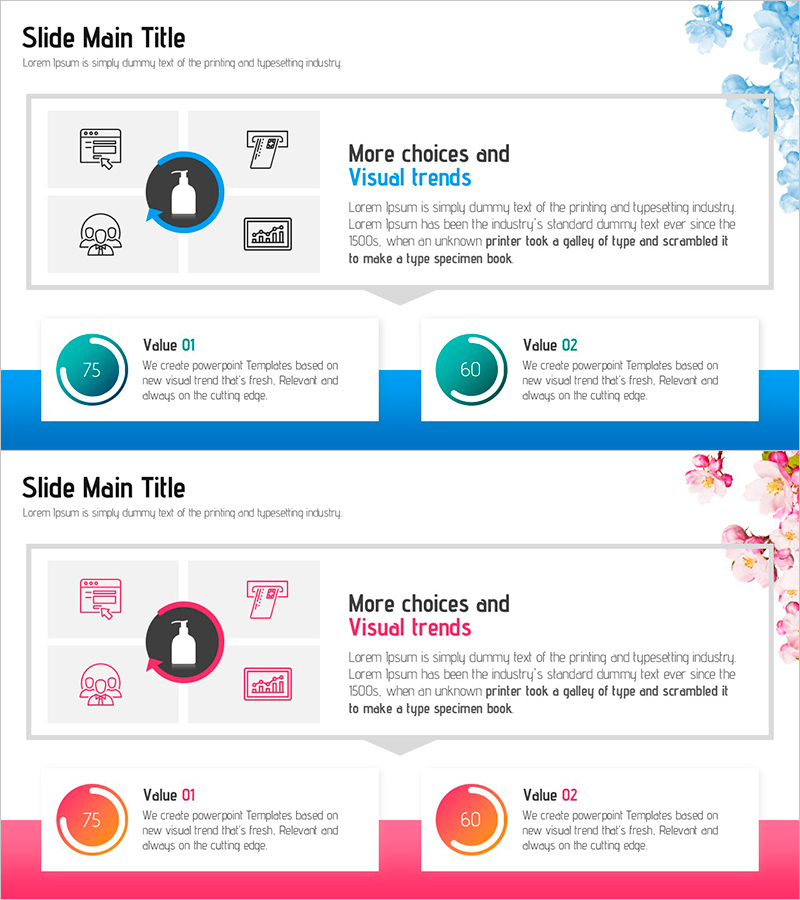
A PowerPoint slide that visualizes business performance and operational systems for cosmetics enterprises in a comparative format. The layout divides the slide into two sections with blue tones on the left and pink tones on the right, effectively presenting contrasting information. The slide includes four icons (website, payment, people, chart), two circular progress indicators (75, 60), and text boxes to communicate both performance metrics and operational strategies. Provided in editable PPTX format, this slide is ideal for business reports, strategic presentations, and performance-sharing materials.
Usage Points
-
Main Usage
Simultaneously visualizes business performance metrics and operational systems to clearly communicate business status to executives, investors, and team members. The blue and pink tone division emphasizes contrasting information, while circular charts and icons combine numerical data with conceptual representation to enhance comprehension.
-
How to Use
Use in the performance section of business reports, quarterly or annual management reports, investor presentations, and team meeting materials. Simply replace text boxes and chart values with actual data for immediate use. Colors and icons can be customized to match your brand identity.
-
Recommended For
Recommended for cosmetics and beauty industry entrepreneurs, marketing and sales professionals, executives preparing reports, performance-sharing coordinators, and investment pitch presenters. Particularly effective when explaining both business performance and operational strategies simultaneously.
-
Slide Structure
Two-slide composition with left-right two-column layout on each slide. Top section contains title and subtitle, center features four icons (website, payment, people, chart) with descriptive text, and bottom displays two circular progress indicators (75, 60 values) with 'Value 01·02' labels for clear information hierarchy.
Related Products
-

Dynamic Gear System for Enhanced Service Operations
#Operational Plan #Technical Approach #Diagram
-

Simple Circle Presentation Template Diagram – Visualizing Flow and Cycle
#Technical Approach #Diagram #Service Operation Plan
-

Tri-Point Analysis in 3D Frames – Operational Planning and Risk Management
#Operational Plan #Technical Approach #Diagram
-

Mapping Key Connections Diagram Slide
#Technical Approach #Diagram #Service Operation Plan
