Analysis of Sales Growth Segments Slide
RJ0800028_11
- Last Update 08/07/2025
- File Size 2.9MB
- # of Slides 2
- File Format PPTX
- Slide Ratio 16:9
- Color
Keywords
- #Content-Based Slides
- #Design-Based Slides
- #Technical Approach
- #Market and Competitor Analysis
- #Diagram
- #Graph
- #Future Development Roadmap
- #Future Outlook
- #Table
- #Line
- #Standard Table
- #Line Chart
- #16:9
- #line chart PowerPoint
- #sales trend analysis slide
- #5-segment data visualization
- #trend graph PPT template
- #business analytics chart slide
About the Product
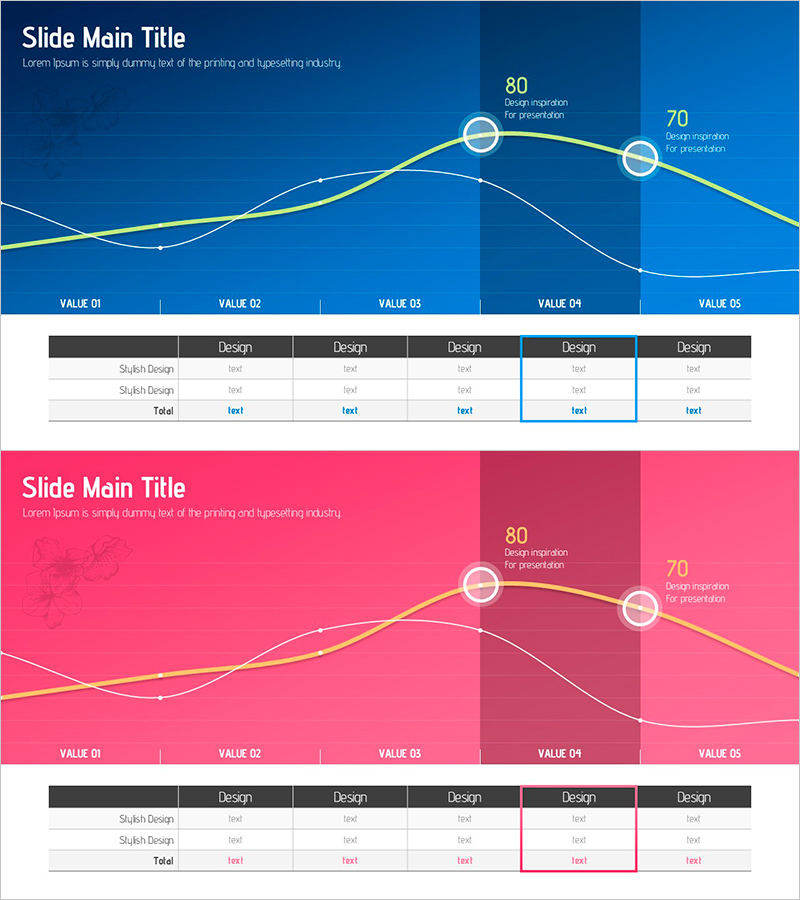
A line chart PowerPoint slide that visualizes sales growth trends across 5 segments with dual-color versions in blue and pink. Each slide features 2 data series (primary and secondary lines) with 5 data points marked by circular nodes and numeric labels (80, 70, etc.). A comparison table with VALUE 01–05 columns is positioned below the chart for quantitative analysis. This presentation slide is ready to use for market analysis, competitive performance benchmarking, and future direction presentations in business reports and investor pitches.
Usage Points
-
Main Usage
Clearly visualize changes in sales, performance, or key metrics over time, and analyze growth patterns and future forecasts through segment-by-segment numerical comparison. Serves as a critical tool for executive reports, business performance presentations, and market analysis materials.
-
How to Use
Select either the blue or pink version to match your corporate brand colors. Input actual sales figures, customer counts, or market share data into the VALUE 01–05 segments. Replace the numeric labels (80, 70) with your real data and update the table row labels (Style Design) with your analysis categories to complete the slide.
-
Recommended For
Ideal for finance and planning teams presenting quarterly or annual performance reports, sales teams analyzing revenue trends, executive KPI dashboards, investor presentations on business growth, and marketing teams measuring campaign effectiveness. Particularly effective for analyzing 5-month to 5-year medium-term trends.
-
Slide Structure
Top section: Title area + 2 line series (yellow and white) + 5 data points (circular nodes with numeric labels 80, 70) + gradient background (blue or pink). Bottom section: 5-column table (VALUE 01–05 headers + 2 Style Design rows + Total row). 2-slide set with color variations.
Related Products
-

Business Strategy Analysis with Line Chart
#Business Strategy #Market and Competitor Analysis #Diagram
-

Trends Visualized with Line Chart
#Technical Approach #Market and Competitor Analysis #Graph
-

Current Status and Prospects of Construction Business – Insightful Analysis
#Technical Approach #Market and Competitor Analysis #Graph
-

Future Technology Industry Analysis Graph – Market Trends and Growth Prediction
#Market and Competitor Analysis #Diagram #Graph
