Aging Graph – Effective Visualization for Market and Competitor Analysis
RJ0800028_28
- Last Update 08/07/2025
- File Size 5.5MB
- # of Slides 2
- File Format PPTX
- Slide Ratio 16:9
- Color
Keywords
- #Content-Based Slides
- #Design-Based Slides
- #Business Vision and Strategy
- #Market and Competitor Analysis
- #Diagram
- #Graph
- #Business Background and Necessity
- #Customer Analysis
- #Cluster
- #Chain Diagram
- #16:9
- #line chart PowerPoint slide
- #trend analysis presentation template
- #market analysis chart
- #competitor comparison graph
- #multi-series data visualization
About the Product
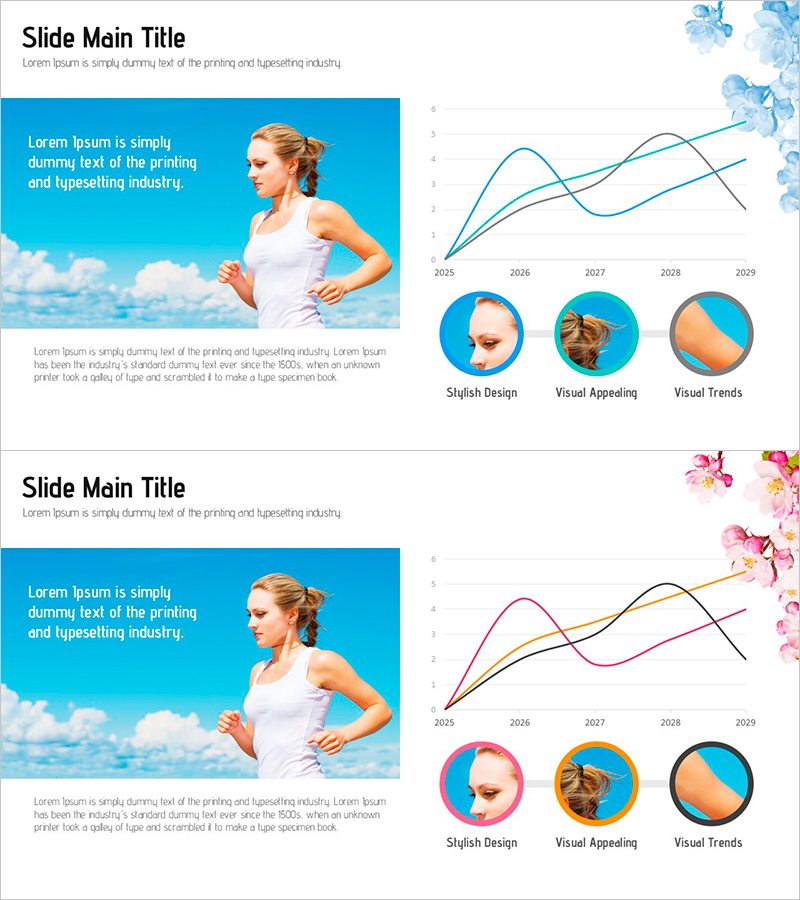
A multi-series line chart PowerPoint slide designed for market analysis and competitive comparison. This presentation template visualizes five-year data trends from 2025 to 2029 across three data series, enabling intuitive trend comparison. The soft blue, pink, and gray gradient lines effectively communicate changes in growth rates, market share, and competitive positioning over time. Ready to use in business reports, strategic presentations, and investor pitches where numerical data trends require clear visual representation.
Usage Points
-
Main Usage
Optimized for comparing numerical changes and trends over time across multiple data series. Simultaneously display market size, revenue trends, customer satisfaction, and competitor performance to identify patterns and correlations at a glance.
-
How to Use
Use in executive reports, business plan presentations, marketing strategy meetings, and investor pitch decks to substantiate past performance and future projections with quantitative data. Edit data values for each series to reflect actual figures, update axis labels and legend with your organization's metrics, and the slide is ready for immediate deployment.
-
Recommended For
Ideal for finance, planning, marketing, and sales professionals including executives, team leads, and analysts presenting quarterly reports, performance reviews, and competitive analysis. Essential for any business presentation requiring multi-year trend analysis, market outlook explanation, or performance benchmarking.
-
Slide Structure
Two-slide set featuring the first slide with blue background, image and text areas, and a three-series line chart with legend. The second slide incorporates pink floral design elements with the same chart in alternative color scheme. Both slides include title, subtitle, descriptive text areas, and chart legend for complete information delivery.
Related Products
-

Visualizing Educational Insights from Surveys with Doughnut Chart
#Market and Competitor Analysis #Diagram #Graph
-

Main & Sub Target Setting Diagram – Strategic Customer Analysis
#Market and Competitor Analysis #Marketing Plan and Strategy #Diagram
-

Target Setting Diagram – Market and Competitor Analysis
#Market and Competitor Analysis #Marketing Plan and Strategy #Diagram
-

Target-specific Analysis Diagram – Customer Insights and Value Delivery
#Product/Service Introduction #Market and Competitor Analysis #Diagram
