Market Competition and Analysis Graphs – Enhance Business Advantage
RJ0800028_19
- Last Update 08/07/2025
- File Size 3.3MB
- # of Slides 2
- File Format PPTX
- Slide Ratio 16:9
- Color
Keywords
- #Content-Based Slides
- #Design-Based Slides
- #Market and Competitor Analysis
- #Graph
- #Other
- #Market Analysis
- #Competitive Advantage
- #Column
- #Grouped Column
- #16:9
- #grouped bar chart PowerPoint
- #market analysis presentation slides
- #competitor analysis graph
- #world map bubble chart
- #multi-series comparison chart PPT
About the Product
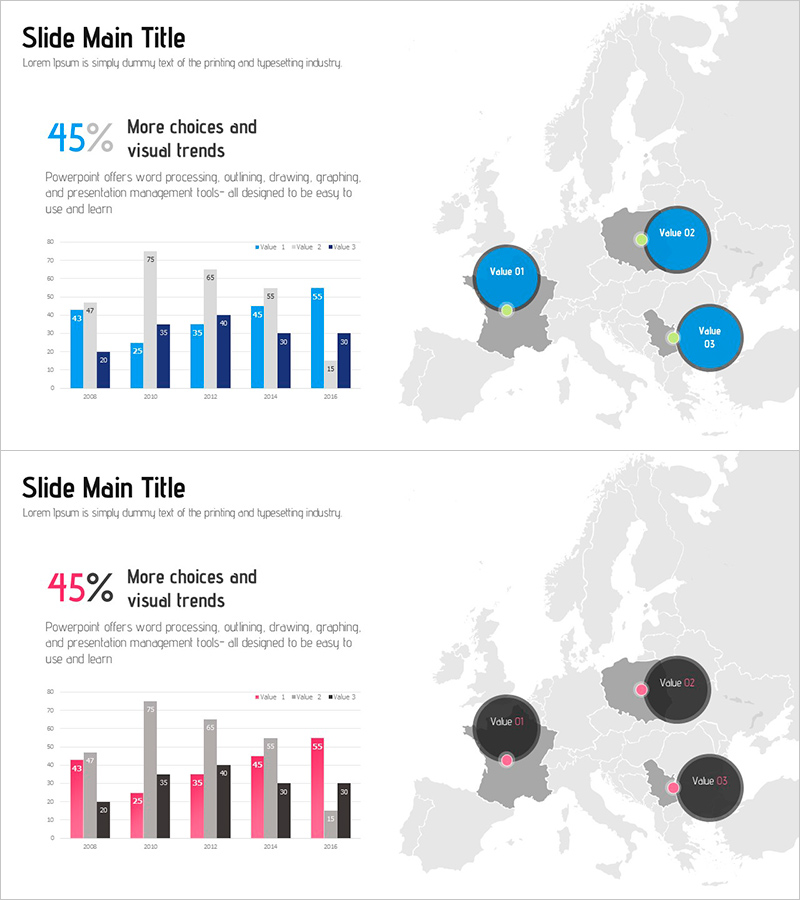
A 2-slide PowerPoint presentation set for visualizing market competition and analysis data. Combines vertical grouped bar charts with world map-based bubble charts to simultaneously display competitor comparison and regional market share. Three data series in blue, pink, and black are structured for year-over-year comparison, ready for immediate use in business strategy presentations, market analysis reports, and competitive advantage enhancement decks. Delivered in 16:9 widescreen PPTX format, fully editable in all PowerPoint versions.
Usage Points
-
Main Usage
Simultaneously analyze and communicate market competition status and regional market share distribution. The vertical grouped bar chart is optimized for year-over-year and competitor-by-competitor numerical comparison, while the circular bubbles on the world map intuitively represent global market distribution. Enhances data credibility in executive briefings, investor pitches, and strategic planning meetings.
-
How to Use
Input actual revenue, market share, or customer figures into the first slide's bar chart, then adjust bubble size and position on the second slide's map to represent regional performance. Modify legend and title text to match presentation context, and customize colors to align with corporate branding. Link data through PowerPoint's chart feature for automatic updates.
-
Recommended For
Recommended for strategy and planning teams' market analysis reports, sales and marketing departments' competitor analysis presentations, executive quarterly and annual performance reviews, investment pitch decks, and consulting firms' market research findings. Particularly valuable for multinational corporations and organizations pursuing global market expansion strategies.
-
Slide Structure
Slide 1: Vertical grouped bar chart (5 years from 2008–2018, 3 data series in blue, pink, and black, with 3 bars grouped per year). Slide 2: Light gray world map background with 3 circular bubbles in blue, pink, and black (labeled Value 01, 02, 03). 16:9 aspect ratio, light gray background, black text and legend.
Related Products
-

Bundled Graphs and Maps for Business Plan Visualization
#Market and Competitor Analysis #Graph #Other
-

Office Interior Analysis Graph - Visualizing Competitive Advantage
#Market and Competitor Analysis #Graph #Market Analysis
-

Layout Design Presentation Template for Market & Competitor Analysis – Column Chart
#Market and Competitor Analysis #Graph #Customer Analysis
-

Circular Gradient Wide Template Bundled Charts
#Market and Competitor Analysis #Graph #Market Analysis
