Growth Graphs and Product Production Strategies Using Bar Charts
RJ0800028_20
- Last Update 08/07/2025
- File Size 2.9MB
- # of Slides 2
- File Format PPTX
- Slide Ratio 16:9
- Color
Keywords
- #Content-Based Slides
- #Design-Based Slides
- #Operational Plan
- #Market and Competitor Analysis
- #Diagram
- #Graph
- #Production and Technology Development Strategy
- #Industry Trends
- #Cluster
- #Column
- #Chain Diagram
- #Segmented Column
- #16:9
- #vertical bar chart PowerPoint
- #growth graph slide template
- #5-year trend chart
- #bar graph presentation
- #data visualization PPT
- #business chart slide download
About the Product
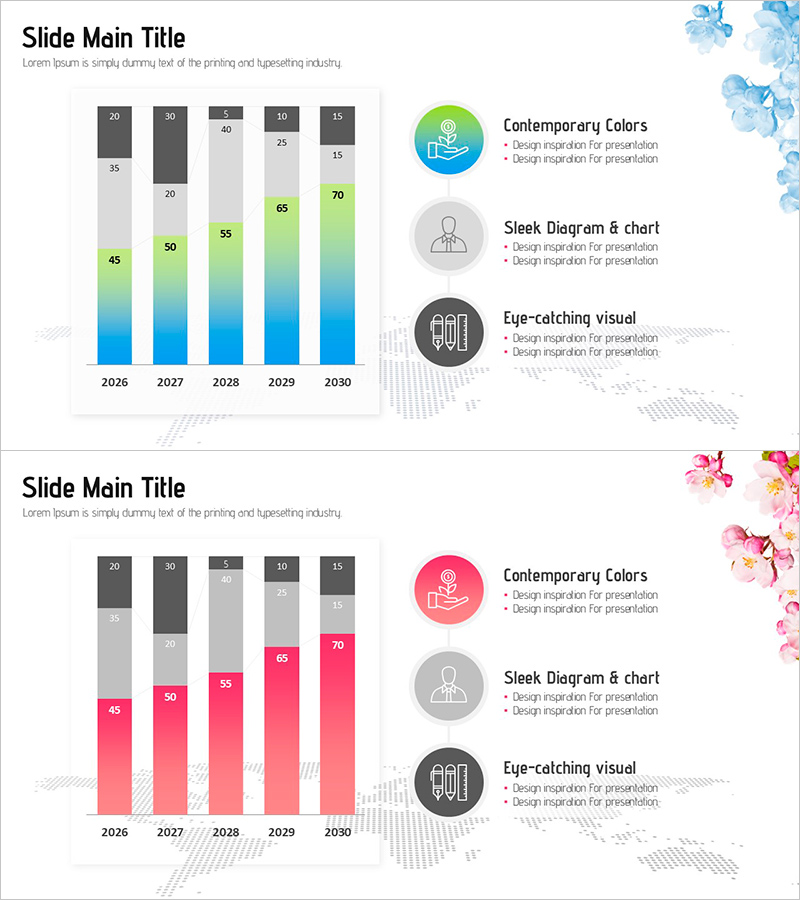
A vertical bar chart PowerPoint slide visualizing 5-year growth data from 2026 to 2030 with blue-to-green gradient coloring and numeric labels. This 2-slide set clearly represents revenue growth, production volume trends, and market share expansion over time. The right side features icon boxes (hand, person, icon) for emphasizing key strategic messages, making it ideal for business presentations, annual reports, and strategic planning decks that require immediate deployment.
Usage Points
-
Main Usage
Clearly visualize year-over-year growth metrics such as revenue increases, production volume changes, and market share expansion, while simultaneously communicating core strategic messages through right-side icon boxes for comprehensive data storytelling.
-
How to Use
Input actual numerical values into the left vertical bar chart and customize the right-side icon box text to match your presentation context. Deploy in business plans, quarterly performance reports, investor pitch decks, and marketing strategy presentations to convey both growth data and strategic direction.
-
Recommended For
Executives, business managers, marketing teams, financial analysts, consultants, and startup founders presenting growth strategies, performance reports, and market expansion plans to stakeholders and investors.
-
Slide Structure
2-slide composition: Slide 1 features blue-to-green gradient 5 vertical bars (2026–2030) with numeric labels per year; Slide 2 adds 3 icon boxes (hand, person, icon) with text areas on the right. 16:9 widescreen format, PPTX file.
Related Products
-

Maple Leaf Arrow Future Plans Slide
#Operational Plan #Technical Approach #Diagram
-

Production and Distribution Strategy – Connection and Expansion Diagram
#Operational Plan #Marketing Plan and Strategy #Diagram
-

Trend of Market Share by Suit Product – Effective Graph for Market Analysis
#Market and Competitor Analysis #Graph #Market Analysis
-

Market Trends Analysis Chart – Effective for Market and Marketing Strategy
#Market and Competitor Analysis #Marketing Plan and Strategy #Diagram
