Donut Slide Visualizing Makeup Market Share
RJ0800028_5
- Last Update 08/07/2025
- File Size 5.4MB
- # of Slides 2
- File Format PPTX
- Slide Ratio 16:9
- Color
Keywords
- #Content-Based Slides
- #Design-Based Slides
- #Business Strategy
- #Market and Competitor Analysis
- #Graph
- #Achievements
- #Market Share
- #Circles
- #Doughnut Chart
- #16:9
- #donut chart PowerPoint slide
- #pie chart template
- #market share visualization
- #two-segment graph
- #donut graph presentation
- #ratio comparison slide
About the Product
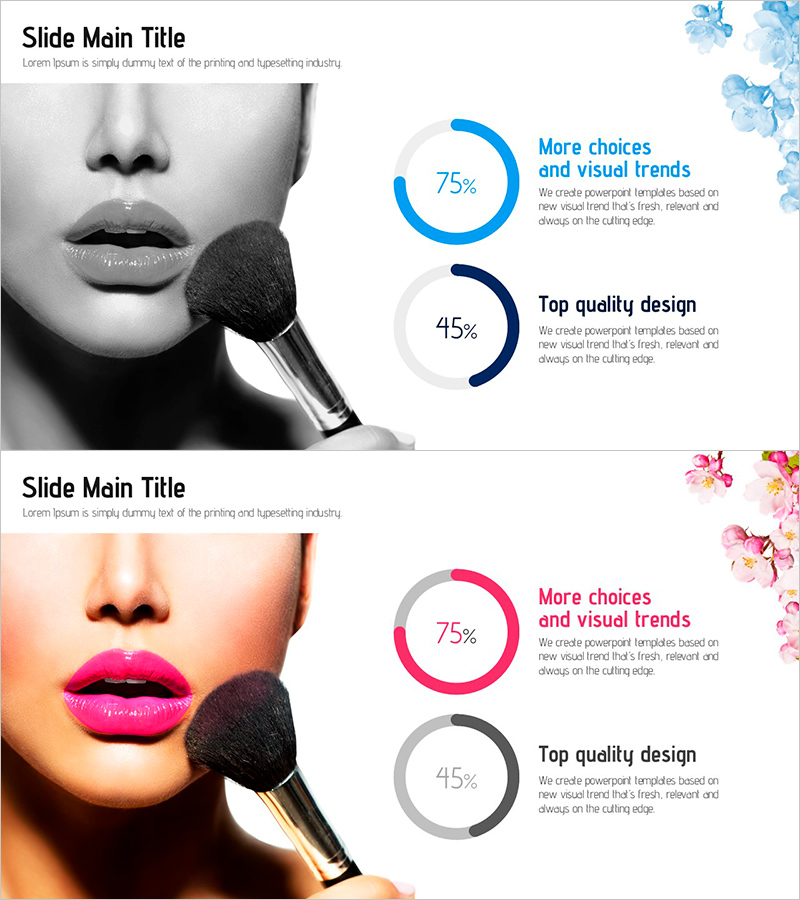
A donut chart PowerPoint slide template visualizing makeup market share with a two-segment pie graph design. The slide features a blue and pink dual-tone color scheme, with a left-side image area and right-side data visualization area. Each segment displays percentage values and descriptive text, making it ideal for comparing market ratios and proportions. The 16:9 widescreen format includes 2 slides ready for immediate use in product presentations, marketing plans, business reports, and investor pitches.
Usage Points
-
Main Usage
Visualize two-item ratio comparisons such as market share, sales distribution, and customer composition using a donut chart format. The hollow center of the donut allows placement of key metrics or brand logos, while the left image area accommodates product photos or illustrations for compelling data storytelling and audience engagement.
-
How to Use
Double-click the donut chart values to edit percentages directly and modify colors as needed. Insert product images or illustrations in the left image area, then add descriptive text in the right text boxes to complete the slide. The blue-pink color scheme works particularly well for beauty, fashion, and lifestyle industries, but can be customized to suit other sectors by changing the color theme.
-
Recommended For
Ideal for beauty and cosmetics companies presenting market analysis, marketing teams reporting customer segmentation, product managers showcasing sales performance, and investment presentations explaining market size. Also suitable for sales team proposals, executive reports, and educational seminar materials.
-
Slide Structure
2-slide set with each slide divided into left 50% image area (featuring black-and-white beauty imagery or custom images) and right 50% data area. The right side contains a 2-segment donut chart (blue 75%, pink 45% example) with corresponding description text boxes. The donut center accommodates key metric values, and the entire layout follows 16:9 widescreen format.
Related Products
-

Donut Chart and Mobile Mockup – Market Share Analysis
#Business Strategy #Market and Competitor Analysis #Graph
-

Donut Chart Slide for Market & Competitive Analysis – Korea's Representative Image Survey
#Business Strategy #Market and Competitor Analysis #Graph
-

Future Target Market Share Donut Chart – Performance and Competitiveness
#Business Strategy #Market and Competitor Analysis #Graph
-

Academic and System Donut Charts – Market Share Analysis
#Business Strategy #Market and Competitor Analysis #Graph
