Annual Drug Use Status Graph – Market Trends Analysis
RJ0700004_12
- Last Update 08/29/2025
- File Size 2.2MB
- # of Slides 2
- File Format PPTX
- Slide Ratio 16:9
- Color
Keywords
About the Product
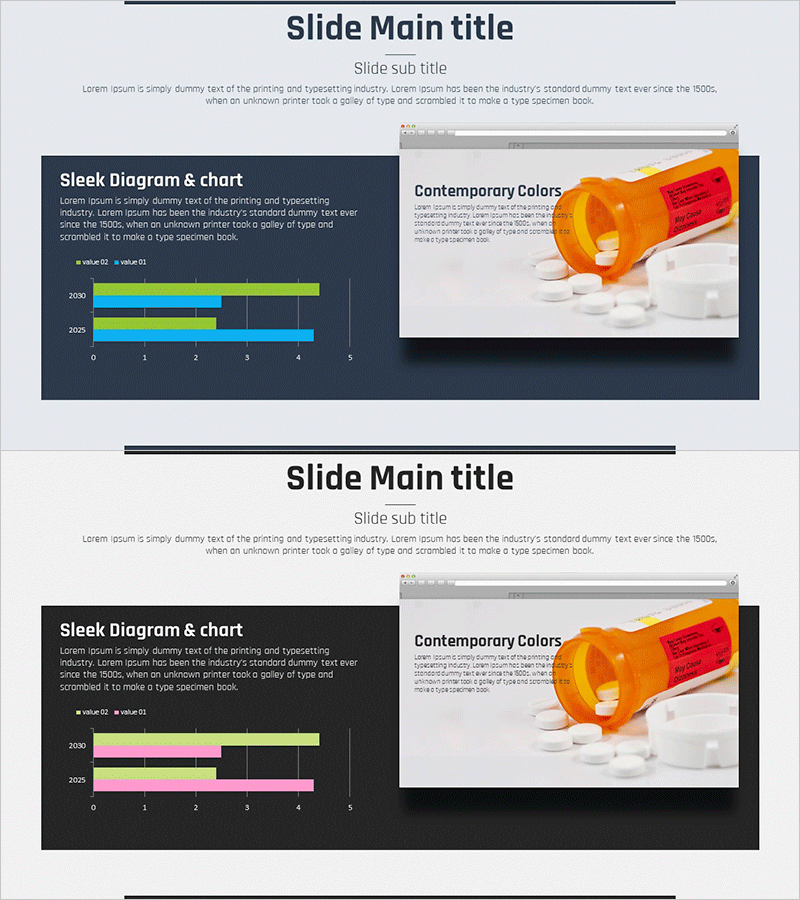
A grouped horizontal bar chart PowerPoint slide visualizing annual drug usage status and market trends across two years. The slide features a dark navy background with multi-color bars in cyan, lime, and orange tones, enabling side-by-side comparison of 2030 and 2025 data. Ideal for pharmaceutical, healthcare, and market research presentations requiring quantitative data visualization. Delivered in 16:9 widescreen PPTX format with 2 fully editable slides.
Usage Points
-
Main Usage
Present pharmaceutical and healthcare market data with quantitative precision. The grouped bar chart format allows simultaneous comparison of multiple data series across two time periods, making it ideal for demonstrating usage trends, market share changes, and competitive positioning to investors, stakeholders, and customers.
-
How to Use
Input your drug usage data into the grouped horizontal bars on the left dark navy section. Customize bar colors (cyan, lime, orange) to represent different drug categories, regions, or product lines. Add legend and value labels for clarity. Replace the right-side image with relevant pharmaceutical or healthcare visuals. Adjust title and descriptive text to match your presentation context.
-
Recommended For
Pharmaceutical executives, marketing teams, and sales professionals presenting drug sales and usage metrics. Healthcare institutions, market research firms, and policy analysts visualizing medical statistics and industry trends. Consultants and academic researchers communicating quantitative health data to diverse audiences.
-
Slide Structure
Two-section layout: left dark navy area contains slide title, descriptive text, and grouped horizontal bar chart with 2 data series (value 01, value 02) across 2 years (2030, 2025). Right light background area displays 'Contemporary Colors' heading and pharmaceutical product image, creating balanced left-right visual composition.
Related Products
-

Cybersecurity Business Market Analysis Graph
#Market and Competitor Analysis #Graph #Competitor Analysis
-

Visualizing Business Strategy with Bar Charts – Market Analysis and Future Outlook
#Market and Competitor Analysis #Diagram #Graph
-

Office Supplies Theme Bundle Bar Graph – Market Status Analysis
#Market and Competitor Analysis #Graph #Market Status
-

White Black Bundle Horizontal Bar Graph
#Market and Competitor Analysis #Graph #Market Analysis
