US Regional Distribution Map for Marketing Strategy – Target Market Analysis
RJ0700004_19
- Last Update 07/22/2025
- File Size 1.1MB
- # of Slides 2
- File Format PPTX
- Slide Ratio 16:9
- Color
Keywords
About the Product
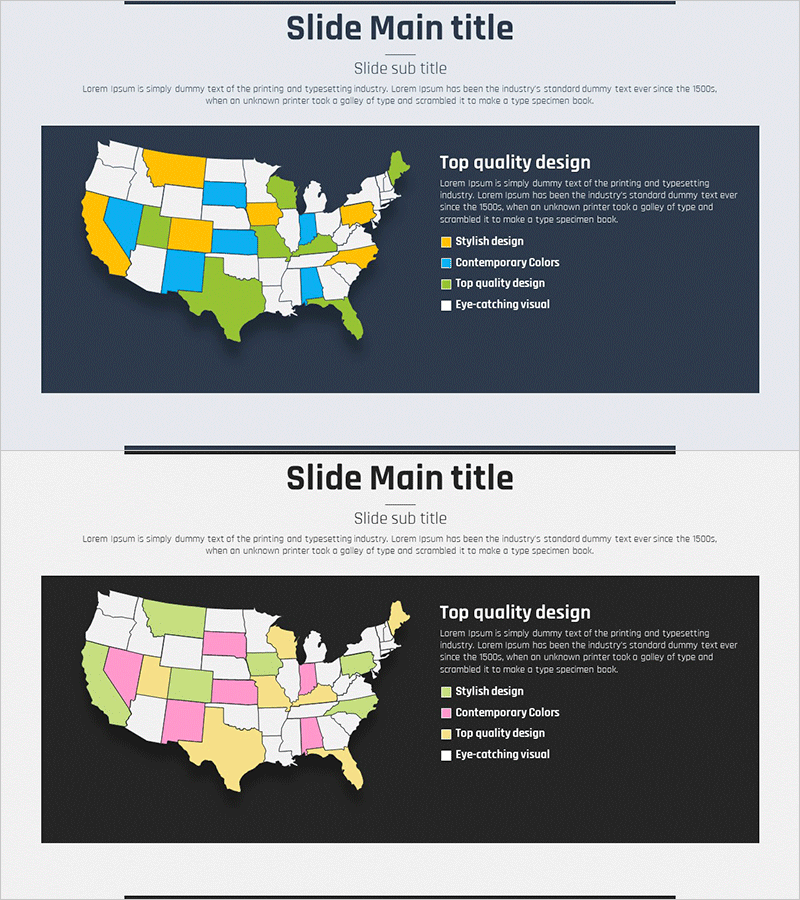
A PowerPoint slide featuring a color-coded map of all 50 US states for visualizing regional market distribution and target market analysis. The dark background with yellow, blue, green, and pink color coding enables clear regional differentiation for sales strategy, market penetration planning, and marketing campaign allocation. The right side includes a legend and text input area for adding regional characteristics, objectives, and strategic details. The 2-slide set provides multiple color combination layouts for flexible presentation needs. Ideal for presenting regional analysis, market entry strategies, and sales performance in business presentations.
Usage Points
-
Main Usage
Visualize the US market by region to effectively communicate target market analysis, regional sales strategies, and marketing campaign planning. Color-coded states enable clear representation of regional characteristics, objectives, and performance metrics.
-
How to Use
Assign colors to each state to represent sales regions, target customer segments, market share, or marketing budget allocation. Use the legend and text area on the right to add regional strategy details, goals, and performance data for comprehensive regional analysis.
-
Recommended For
Marketing managers, sales strategists, regional expansion directors, and executives presenting US market entry plans to investors. Effectively communicates regional sales performance, market share distribution, and marketing budget allocation across different geographic areas.
-
Slide Structure
2-slide set with dark background US map, color-coded state regions, right-side legend showing 4 color categories, and text input areas for title and description. State names are displayed on the map, with legend and analysis content space positioned on the right side.
Related Products
-

Target Country Settings and Marketing Strategies – Insights for Market Entry
#Marketing Plan and Strategy #Other #Target Market Strategy
-

Smart Travel App Business Overview Page – Optimal Market Strategy
#Marketing Plan and Strategy #Other #Target Market Strategy
-

Target Market Emphasis Message – Clarifying Strategy for Target Market
#Marketing Plan and Strategy #Other #Target Market Strategy
-

European Regional Distribution Map Table – Clarifying Market Strategy
#Marketing Plan and Strategy #Diagram #Other
