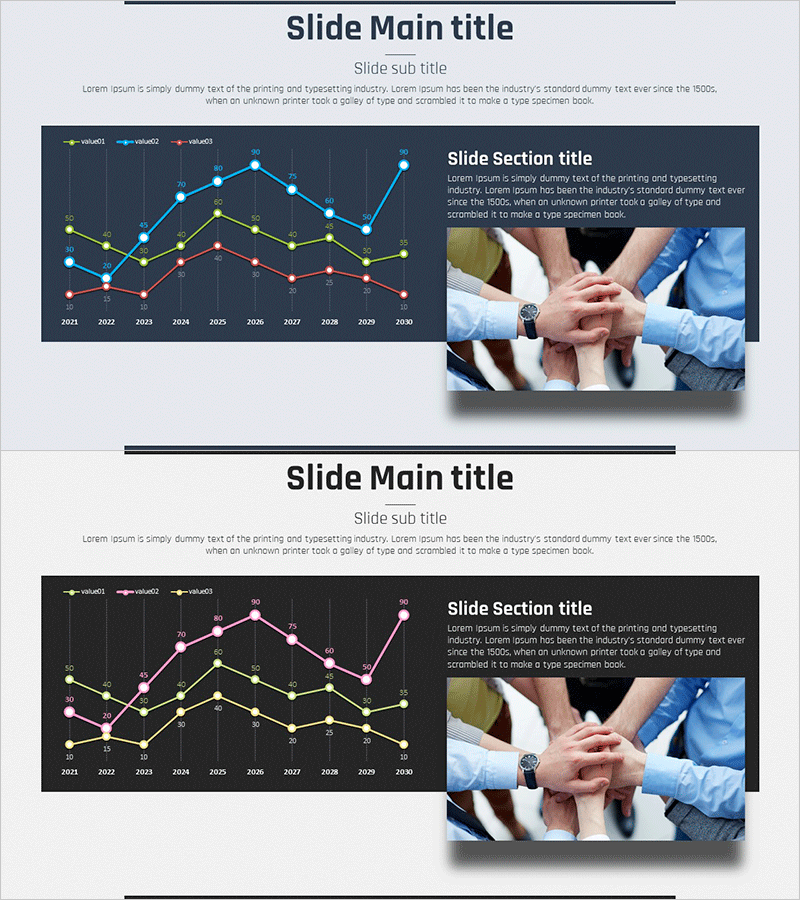
Successful Business Analysis Line Graph
RJ0700004_6
- Last Update 07/22/2025
- File Size 2.5MB
- # of Slides 2
- File Format PPTX
- Slide Ratio 16:9
- Color
Keywords
About the Product
A multi-series line graph PowerPoint slide optimized for business analysis and market research presentations. Three data series (blue, yellow, and red) are displayed against a dark background to clearly visualize year-over-year trend changes from 2021 to 2030. Perfect for presenting sales performance, revenue trends, competitive benchmarking, and key business metrics. Each data point includes numerical labels for precise information delivery. This 2-slide template is ready to use in presentations, reports, and strategic planning documents.
Usage Points
-
Main Usage
Visualize year-over-year trends, compare multiple data series, and display performance metrics using a multi-series line graph. Effectively communicates quantitative data changes over time for business analysis, market research, and competitive analysis. Enables quick pattern recognition of rising and falling trends across different data sets for informed decision-making.
-
How to Use
Insert into the analysis section of presentations, performance pages of business reports, and market analysis portions of marketing plans. The dark background design ensures high readability in projector environments. Customize data values, colors, labels, and legends to match your specific dataset and branding requirements.
-
Recommended For
Finance professionals, marketing teams, executives preparing reports, consultants, and data analysts. Suitable for quarterly and annual performance reviews, sales trend explanations, market share comparisons, customer satisfaction tracking, and competitive positioning analysis.
-
Slide Structure
2-slide template featuring 3 data series (blue, yellow, red) plotted across 10 years (2021-2030). X-axis displays years, Y-axis shows numerical scale. Each data point includes precise numerical labels. Includes legend and title areas. Dark background with bright series colors creates strong visual contrast for clarity.
Related Products
-

Competitor Capability Analysis Chart – Efficient Market Analysis
#Market and Competitor Analysis #Graph #Competitor Analysis
-

Gradient Line Graph – Market and Competitor Analysis
#Market and Competitor Analysis #Graph #Competitor Analysis
-

Competitor Technology Comparison Graph – Market and Competitor Analysis
#Market and Competitor Analysis #Graph #Competitor Analysis
-

Project Market Environment Analysis Chart – Powerful Competitive Strategy
#Market and Competitor Analysis #Graph #Competitor Analysis
