Graph Showing Distribution Status by Country – Market Share Analysis
RJ0700004_16
- Last Update 07/22/2025
- File Size 1MB
- # of Slides 2
- File Format PPTX
- Slide Ratio 16:9
- Color
Keywords
About the Product
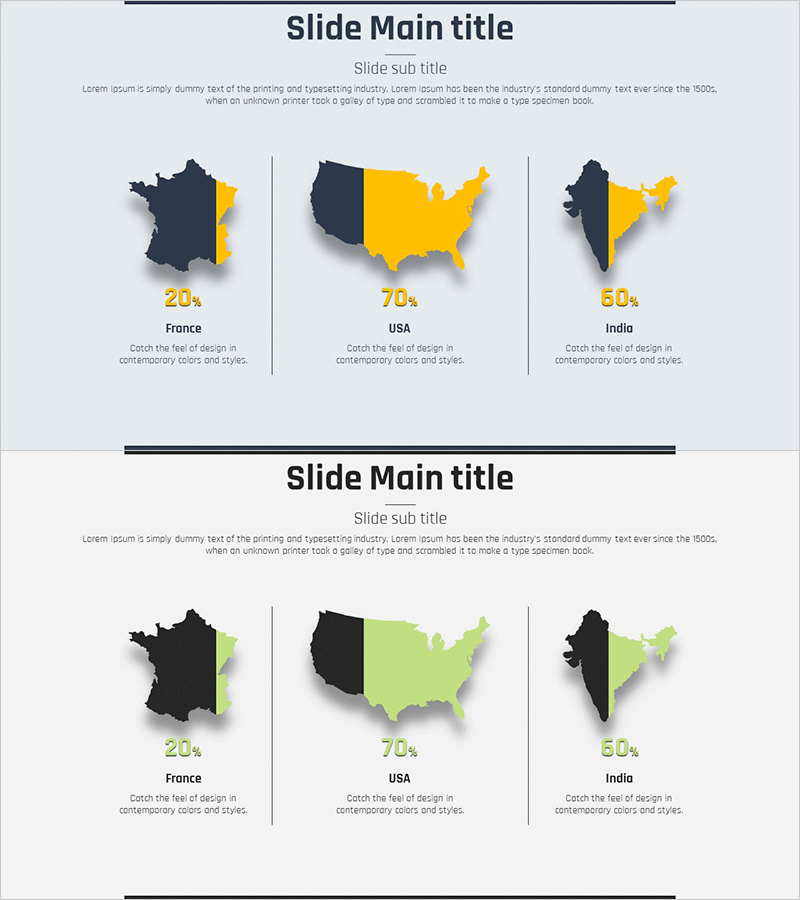
A PowerPoint slide designed to visualize market share and regional distribution across countries. The dark navy background with yellow and lime green accent colors highlights the distribution data for France, USA, and India, enabling instant comparison of regional percentages. The 2-slide set provides color variations (yellow/lime green) to match your presentation's visual tone. Clear separation between text input areas and percentage values makes it ideal for presenting market analysis, regional sales performance, and global business expansion data in business reports, investor pitches, and strategic planning presentations.
Usage Points
-
Main Usage
Visualize global market analysis, regional sales performance, and country-level business expansion using map-based charts. Effectively communicate regional percentage comparisons to investors, executives, and stakeholders during presentations, board reports, and strategic planning sessions.
-
How to Use
Enter percentage values in each country map area and add country names with descriptions in the text fields below. Use the color variation slides (yellow/lime green) to differentiate presentation sections by tone. Duplicate map areas to add additional countries or regions as needed for your analysis.
-
Recommended For
Recommended for executives and business development teams presenting global expansion, marketing teams analyzing regional market share, finance teams reporting country-level revenue distribution, and IR teams preparing international investment pitches.
-
Slide Structure
2-slide set with Slide 1 featuring yellow dual-tone map chart and Slide 2 with lime green dual-tone map chart. Each slide contains 3 country map areas, percentage value input spaces, and country name/description text fields for easy data entry and customization.
Related Products
-

Orange Hexagon Template World Map – Market Analysis Insights
#Market and Competitor Analysis #Graph #Other
-

Target Country Market Share Analysis Graph
#Market and Competitor Analysis #Graph #Other
-

Target Area Market Share Analysis Graph – Emphasizing Market Competition
#Market and Competitor Analysis #Graph #Other
-

Donut Chart in Overseas Markets – Market Share Analysis
#Market and Competitor Analysis #Graph #Other
