Yellow Green Double Bar Graph – Market and Competitor Analysis
RJ0700004_18
- Last Update 07/22/2025
- File Size 1MB
- # of Slides 2
- File Format PPTX
- Slide Ratio 16:9
- Color
Keywords
About the Product
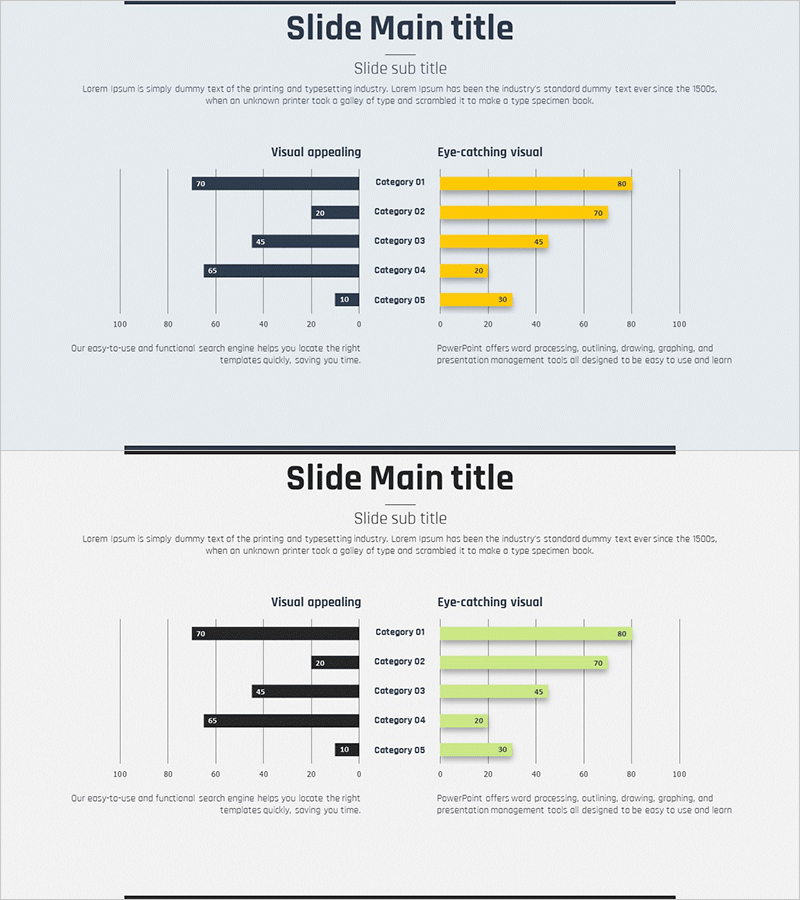
A dual-axis bar chart PowerPoint slide optimized for market and competitor analysis presentations. This template features navy blue bars on the left and yellow-green bars on the right, enabling direct comparison of two data series across five categories. The 16:9 widescreen format with 2-slide layout is ready for immediate use in business reports, pitch decks, and strategic presentations. Perfect for visualizing market share versus competitor performance, product feature comparisons, customer satisfaction metrics, or any quantitative analysis requiring side-by-side data evaluation. Simply replace the sample data and category labels to match your analysis context.
Usage Points
-
Main Usage
Enables direct comparison of two data series across five categories, making market share differences, competitive advantages, and performance gaps immediately visible. The navy-to-yellow-green color contrast draws viewer attention and reinforces the comparative intent of your analysis.
-
How to Use
Insert into the market analysis section of business plans, competitive landscape slides in executive reports, or market opportunity pages in investor pitch decks. Edit the numerical values to reflect your actual data and customize category labels to match your specific analysis context for immediate presentation use.
-
Recommended For
Marketing professionals, business development teams, executives, management consultants, and data analysts who need to communicate quantitative comparisons. Ideal for market research presentations, competitive benchmarking, performance reviews, product feature comparisons, and any scenario requiring side-by-side numerical analysis.
-
Slide Structure
2-slide template with 5 categories (Category 01–05) per slide. Each category displays a navy bar (0–100 scale) on the left and a yellow-green bar (0–100 scale) on the right for direct numerical comparison. Descriptive text area at the bottom accommodates analysis commentary and insights.
Related Products
-

Surgical Site Analysis Graph – Market and Competitive Analysis
#Market and Competitor Analysis #Graph #Competitor Analysis
-

Halloween Witch and Two-way Graph
#Market and Competitor Analysis #Graph #Competitor Analysis
-

Competitor Comparison Analysis Graph
#Market and Competitor Analysis #Graph #Competitor Analysis
-

Car Wide Template Bilateral Bar Graph
#Market and Competitor Analysis #Graph #Competitor Analysis
