Analyzing Exercise Competitive Advantage with Doughnut Chart – Business Insights
RJ0700004_25
- Last Update 07/22/2025
- File Size 2.2MB
- # of Slides 2
- File Format PPTX
- Slide Ratio 16:9
- Color
Keywords
About the Product
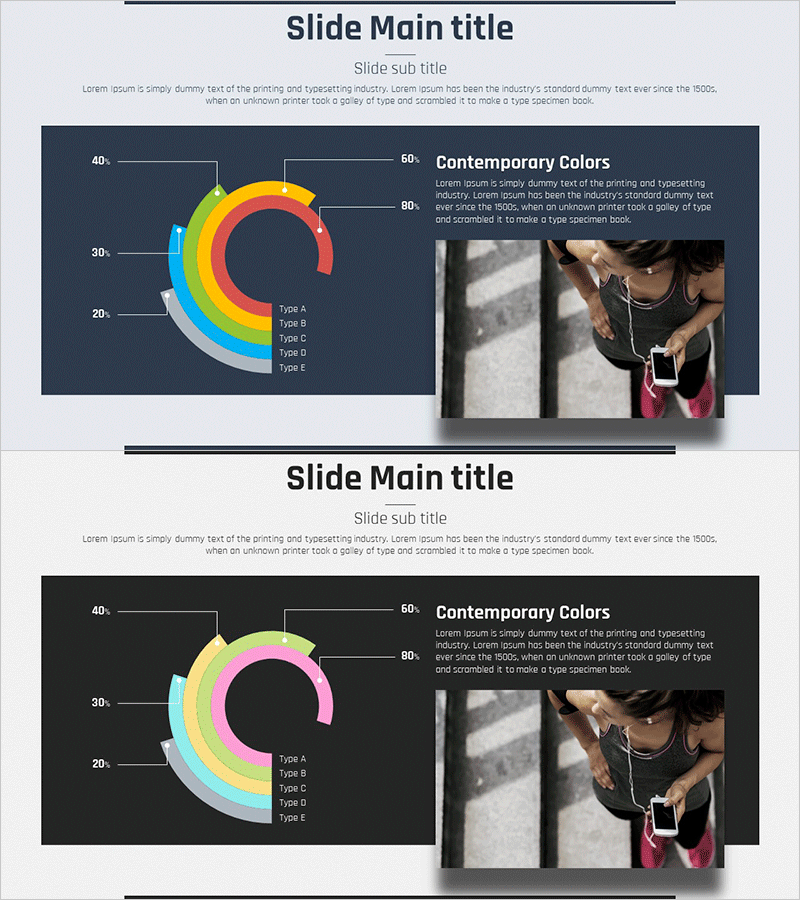
A PowerPoint slide featuring a 5-segment doughnut chart for visualizing proportional data across categories. The design uses a dark background with a vibrant multicolor gradient chart (rainbow spectrum), accompanied by a numerical scale (20–60) on the left axis. The right section includes a Contemporary Colors area for additional text, insights, or image placement. Ideal for presenting competitive advantage analysis, market share distribution, product composition ratios, and business performance metrics. This 2-slide template is ready to use and fully editable for immediate presentation deployment.
Usage Points
-
Main Usage
Visualize proportions, market share, and composition across five categories using a doughnut chart to communicate competitive positioning, market insights, and strategic analysis in business presentations.
-
How to Use
Input your data into the left doughnut chart, add analysis text or images to the right Contemporary Colors section, and customize colors and values to match your presentation theme. All elements are fully editable.
-
Recommended For
Recommended for executives, marketing teams, strategy departments, and sales professionals presenting strategic analysis, market research, investor pitches, product overviews, and competitive positioning in board meetings and executive briefings.
-
Slide Structure
2-slide template. Each slide contains a 5-segment doughnut chart on the left (with Type A–E legend and 20–60 numerical scale), and a right panel with title, descriptive text area, and image placeholder for comprehensive data storytelling.
Related Products
-

Current Status of Space Business Visualized with Donut Chart - Competitive Edge Analysis
#Market and Competitor Analysis #Graph #Competitor Analysis
-

Visualization of War Equipment Penetration Rate – Market Share Analysis
#Market and Competitor Analysis #Graph #Market Share
-

Competitive Advantage Analysis Diagram – Drive to Market Success
#Product/Service Introduction #Market and Competitor Analysis #Diagram
-

Market Analysis and Competitive Advantage Graph – The Power of Data Visualization
#Market and Competitor Analysis #Graph #Market Analysis
