Pill Ingredient Analysis Bar Graph – Visualizing Market Status
RJ0700004_10
- Last Update 07/22/2025
- File Size 1.3MB
- # of Slides 2
- File Format PPTX
- Slide Ratio 16:9
- Color
Keywords
About the Product
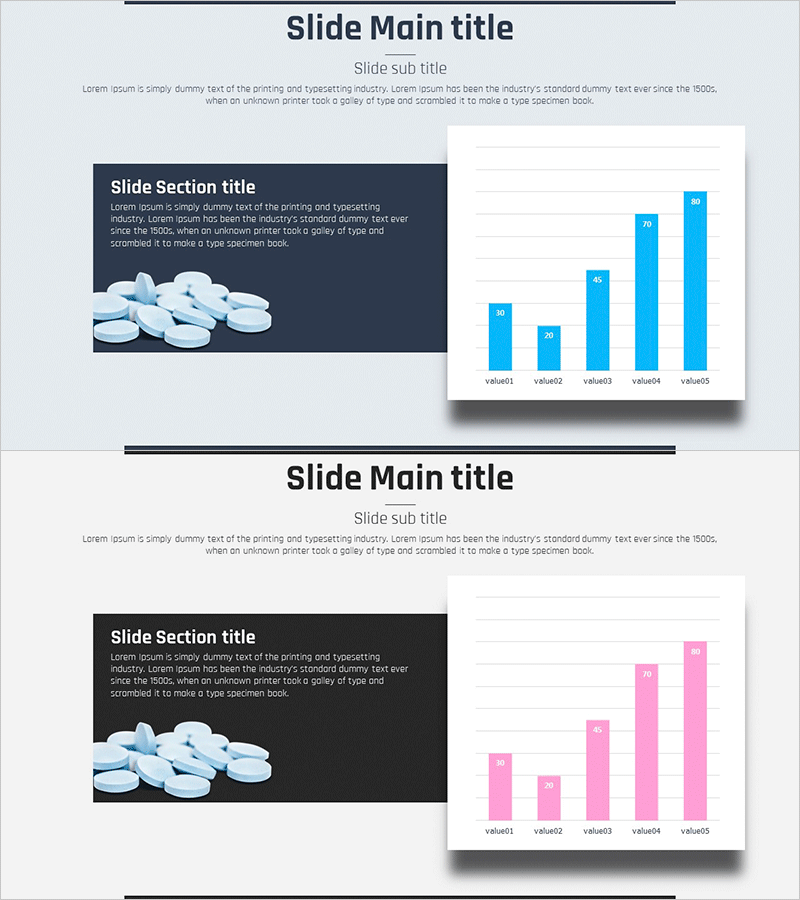
A horizontal bar graph PowerPoint slide designed to visualize pharmaceutical ingredient analysis and market status data with clarity and impact. The slide features five comparable data items displayed as blue-toned bars, with a dark navy section on the left containing title and descriptive text for comprehensive information delivery. This 16:9 widescreen 2-slide set is ready for immediate use in pharmaceutical, healthcare, and medical industry presentations, marketing decks, and competitive analysis reports. The clearly defined data input areas make editing and customization straightforward for any dataset.
Usage Points
-
Main Usage
Presents five-item numerical datasets such as pharmaceutical ingredient composition, market research findings, competitive analysis, or sales performance through intuitive bar length comparison. The blue color palette conveys professionalism and credibility, while the left text area accommodates analysis context, methodology, and key conclusions alongside the visual data.
-
How to Use
Enter your analysis title, background, and interpretation in the left dark navy box. Replace value1 through value5 item names and numerical values with your own data. Bar lengths adjust automatically; colors and fonts can be customized to match corporate branding. Simply drag-and-drop additional slides into pharmaceutical, medical, or chemical industry presentations and reports.
-
Recommended For
Pharmaceutical marketing teams, healthcare institution planners, market research analysts, product development managers, academic presenters, and investor relations professionals presenting ingredient comparisons, market share, sales performance, clinical trial data, or competitive benchmarking.
-
Slide Structure
2-slide set with consistent layout. Each slide divides into left 40% dark navy background text area (title and description) and right 60% white background horizontal bar graph area. Graph displays 5 items (value1–value5) with bars and numerical labels in blue gradient. 16:9 widescreen format optimized for modern presentation environments.
Related Products
-

Idea Derivation Bar Chart Template – Market and Competitor Analysis
#Market and Competitor Analysis #Marketing Plan and Strategy #Graph
-

Usage Status and Trends by Application Graph - Horizontal & Vertical Bar Utilization
#Business Introduction #Market and Competitor Analysis #Graph
-

Global Market Share and User Growth Statistics – Popularity of AI Tools
#Market and Competitor Analysis #Graph #Market Status
-

Real Estate Sales and Consumer Analysis Slide
#Market and Competitor Analysis #Graph #Market Status
