Blue Gray Table Chart – Stylish Data Representation
RJ0700004_29
- Last Update 07/22/2025
- File Size 1MB
- # of Slides 2
- File Format PPTX
- Slide Ratio 16:9
- Color
Keywords
About the Product
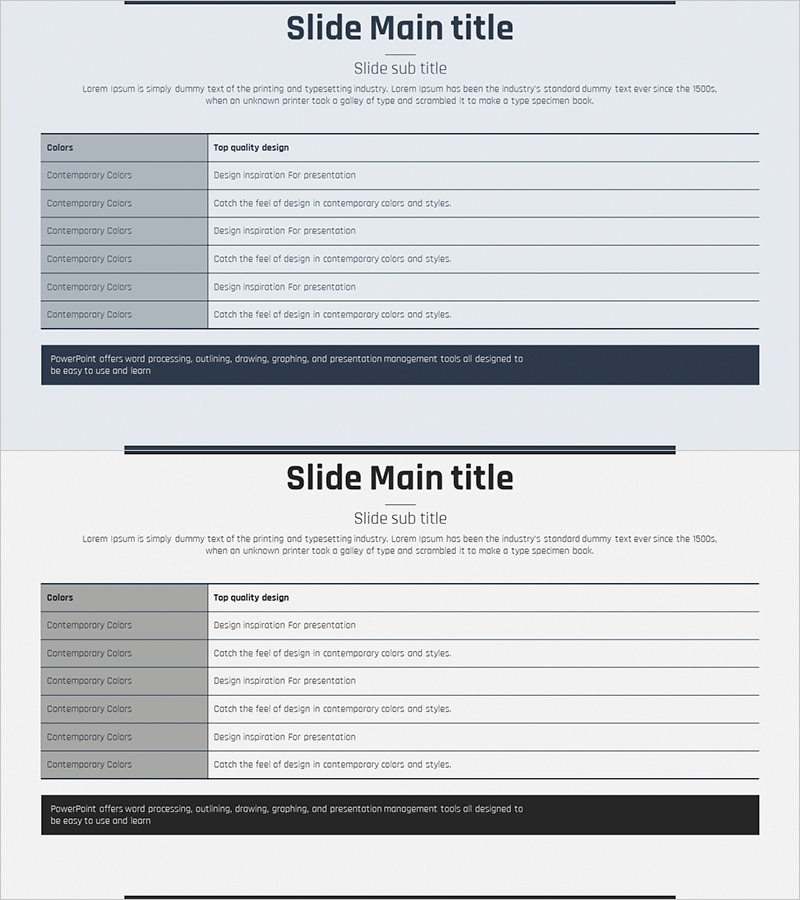
A blue gray table diagram PowerPoint slide set featuring a 6-row by 2-column structure for systematic data organization. The header row uses dark gray while data rows use light gray, creating clear visual hierarchy for information presentation. This 2-slide set is optimized for 16:9 widescreen format and works seamlessly in business reports, proposals, and marketing presentations. The table design enables quick comparison analysis, feature listing, process steps, and organizational structure visualization. All elements are built with standard PowerPoint shapes, allowing full text and color customization without design software.
Usage Points
-
Main Usage
This slide presents business data in organized table format for comparison and analysis. The three-column structure (color, item, description) visualizes product features, price comparisons, process steps, and organizational hierarchies. The color-coded header and data rows establish clear information priority and improve audience comprehension.
-
How to Use
Simply click each cell and enter your text for item names, descriptions, or numerical values. Colors are fully editable using PowerPoint's shape fill function, and rows can be easily added or removed. Apply this template to report analysis sections, proposal comparison tables, marketing plan competitive analysis, and any page requiring structured data presentation.
-
Recommended For
Business analysts, market researchers, and product managers benefit from this template when comparing competitors, segmenting customers, or analyzing technology stacks. Educational and seminar materials use it for learning objectives, evaluation criteria, and performance metrics. Recommended for all business presentations requiring clear information hierarchy and structured table layouts.
-
Slide Structure
A 2-slide set, each featuring a 6-row 2-column table diagram. The first row serves as the header (dark gray background) for item titles, while the remaining 5 rows provide data entry areas (light gray background). Consistent blue gray tones maintain professionalism throughout, optimized for 16:9 widescreen display.
Related Products
-

Business Area Diffusion Diagram – Directions for Business Development
#Company Introduction #Business Introduction #Diagram
-

Identity Wide Template Featuring Pyramid Diagram
#Marketing Plan and Strategy #Diagram #Target Market Strategy
-

PowerPoint Template for Service Operation Strategy Presentation
#Business Management #Operational Plan #Technical Approach
-

Introduction to the Apparel Business Area Program - Cluster Diagram
#Product/Service Introduction #Business Introduction #Diagram
