Successful Teamwork Analysis Graph
RJ0700004_28
- Last Update 07/22/2025
- File Size 2MB
- # of Slides 2
- File Format PPTX
- Slide Ratio 16:9
- Color
Keywords
- #Content-Based Slides
- #Design-Based Slides
- #Technical Approach
- #Market and Competitor Analysis
- #Graph
- #Research and Development
- #Market Analysis
- #Column
- #Segmented Column
- #16:9
- #grouped bar chart PowerPoint
- #bar graph slide template
- #data comparison chart
- #team performance analysis
- #trend visualization slide
About the Product
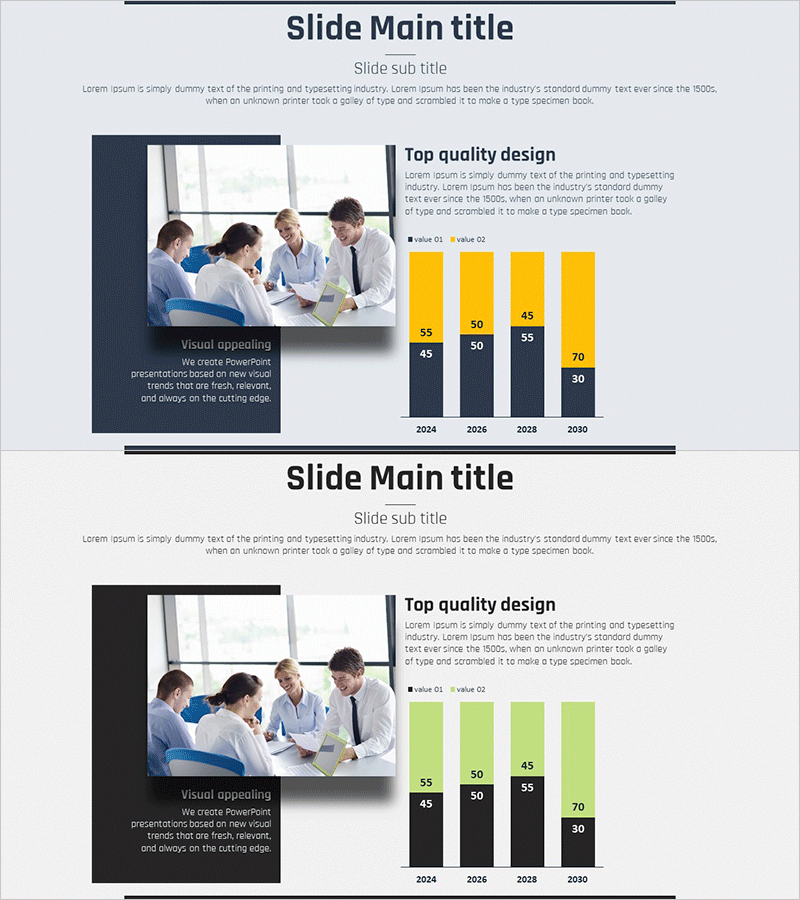
A grouped bar chart PowerPoint slide that visualizes team performance analysis across multiple metrics. This slide compares data from 2024 to 2030 using two data series (Value Q1 and Value Q2), making it ideal for quarterly performance reviews, competitive benchmarking, and year-over-year trend analysis. The design features a dark navy background with yellow and lime green bar colors for strong visual contrast, with clear numerical labels on each bar for precise data communication. The two-column layout combines a team collaboration image on the left with the chart on the right, creating a compelling narrative flow. Fully editable PPTX format allows instant customization for your specific data and messaging.
Usage Points
-
Main Usage
This slide enables side-by-side comparison of multiple performance metrics over time, allowing audiences to quickly identify trends, performance gaps, and improvement trajectories. The dual-series bar structure makes it perfect for benchmarking against competitors, comparing departmental results, or tracking KPI progress across quarters. Essential for data-driven presentations in business reports, investor updates, and strategic planning sessions.
-
How to Use
The left-side team image establishes context while the right-side chart delivers quantitative evidence of performance. Use the color-coded bars to highlight key differences between data series, and leverage the numerical labels to support specific talking points. Consider adding slide animations to reveal bars sequentially, building audience engagement as you walk through each time period and metric.
-
Recommended For
Ideal for executives, team leads, and project managers presenting quarterly or annual performance results. Marketing teams can use it for campaign ROI comparison, sales teams for pipeline analysis, and operations teams for efficiency metrics. Perfect for board meetings, investor presentations, departmental reviews, and strategic planning sessions where data credibility is paramount.
-
Slide Structure
Two-slide set with consistent layout: left section features a professional team collaboration image, right section contains a grouped bar chart with X-axis (2024–2030), Y-axis (numerical values), and two data series bars per year. Each bar displays precise numerical labels. Dark navy background with yellow and lime green bar colors ensures high contrast and readability. The balanced two-column composition maintains visual harmony while prioritizing data clarity.
Related Products
-

Trend of Market Share by Suit Product – Effective Graph for Market Analysis
#Market and Competitor Analysis #Graph #Market Analysis
-

3D Segmented Bar Graph for Performance Analysis – Market Trends
#Market and Competitor Analysis #Graph #Customer Analysis
-

Infographic Slide for Data Visualization and Analysis
#Technical Approach #Market and Competitor Analysis #Graph
-

Vertical Bar Chart for Learning Outcomes Comparison - Market Share Visualization
#Market and Competitor Analysis #Graph #Market Analysis
