Car Accident Presentation Template – Striking Visuals with Clean Design
J0600047
- Last Update 01/06/2025
- File Size 11.6MB
- # of Slides 20
- File Format PPTX
- Slide Ratio 16:9
- Color
Slide Preview


Keywords
About the Product
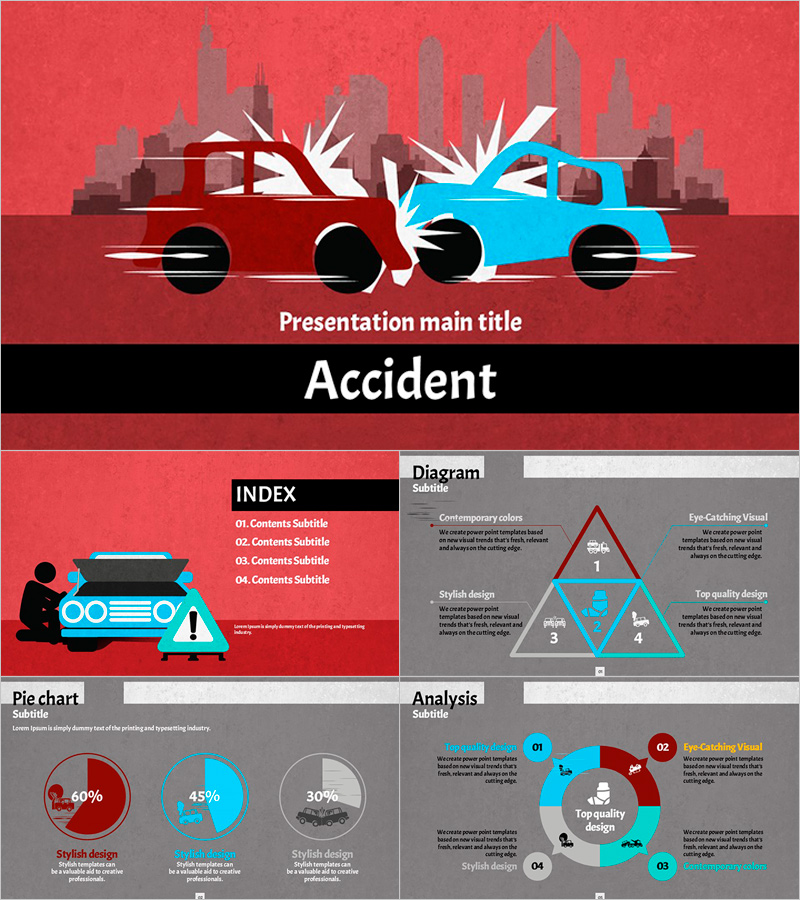
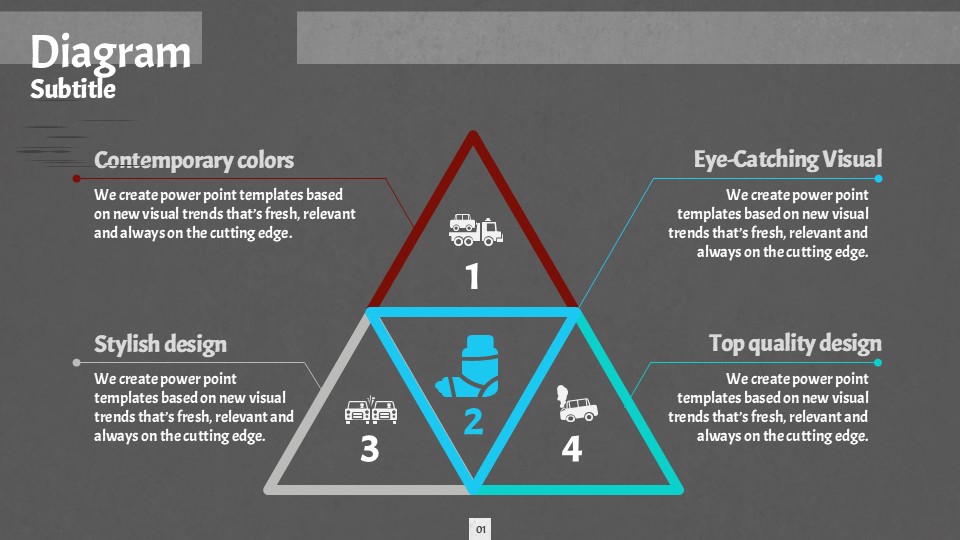
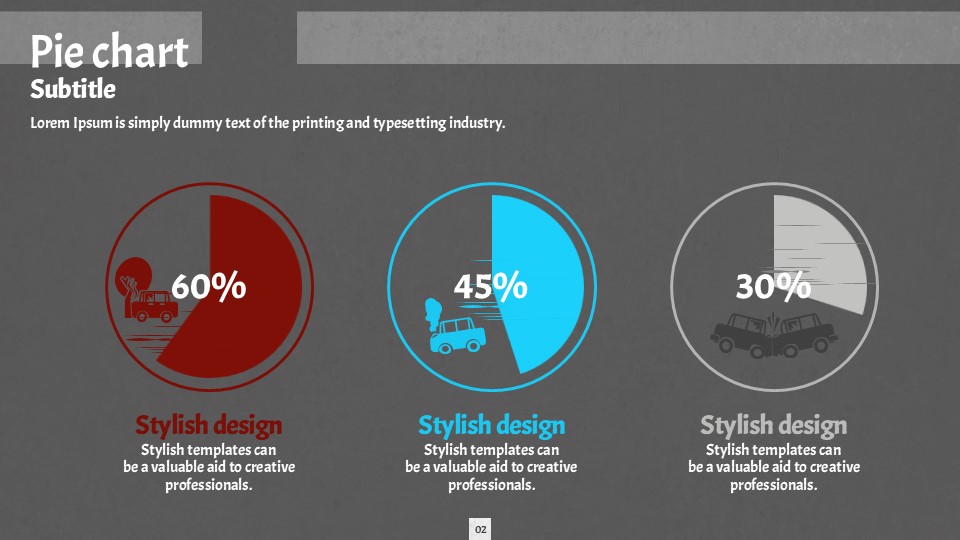
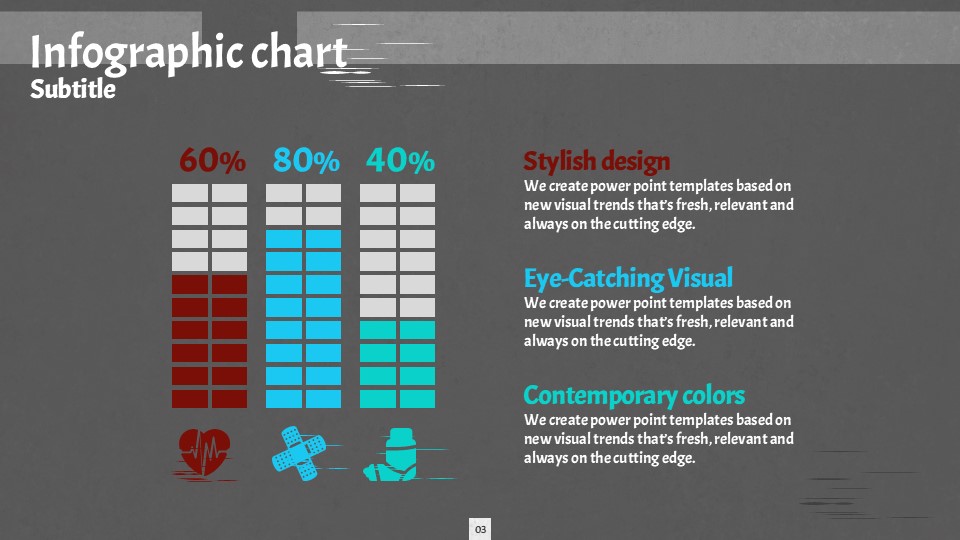
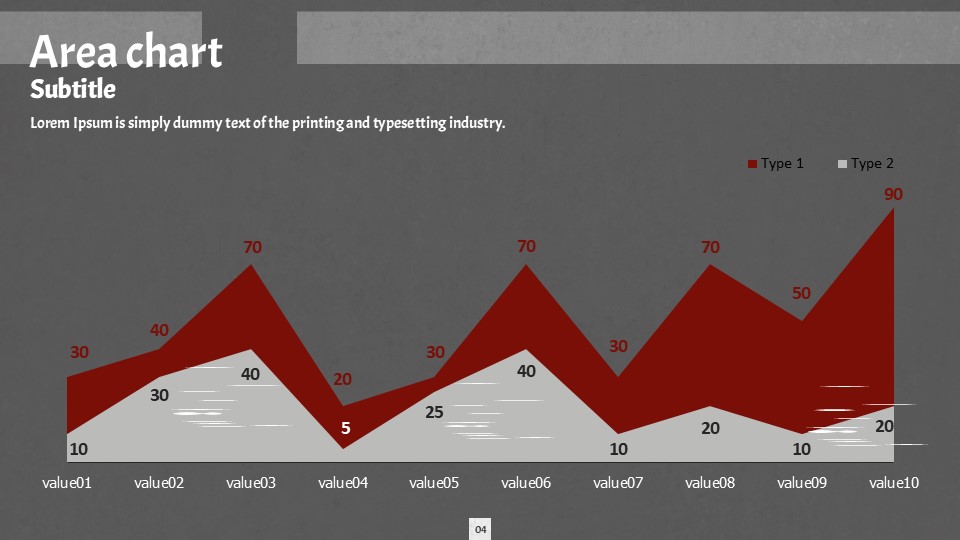
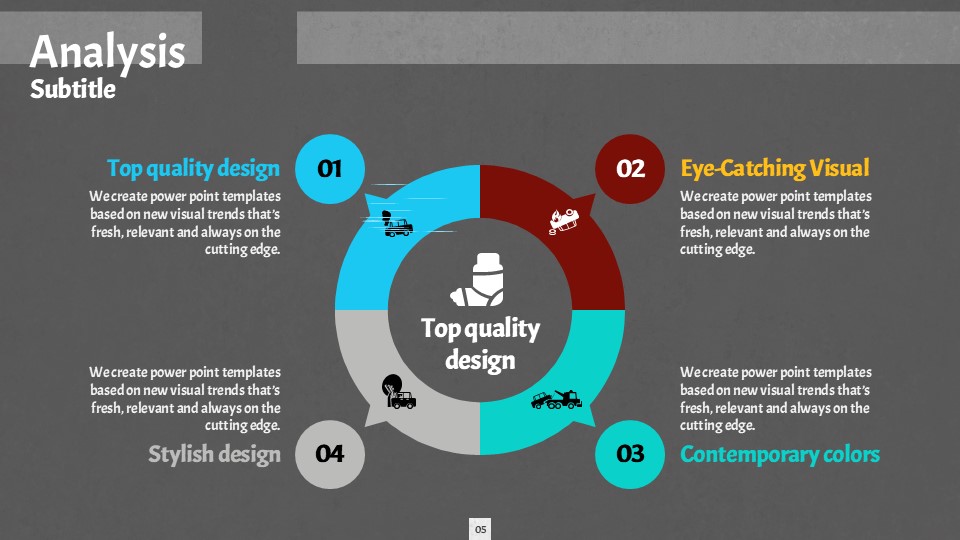
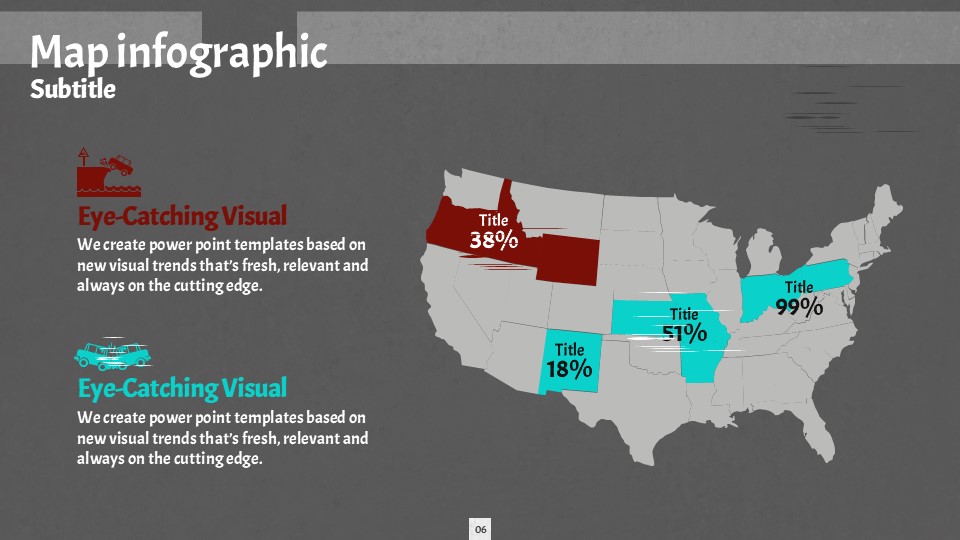
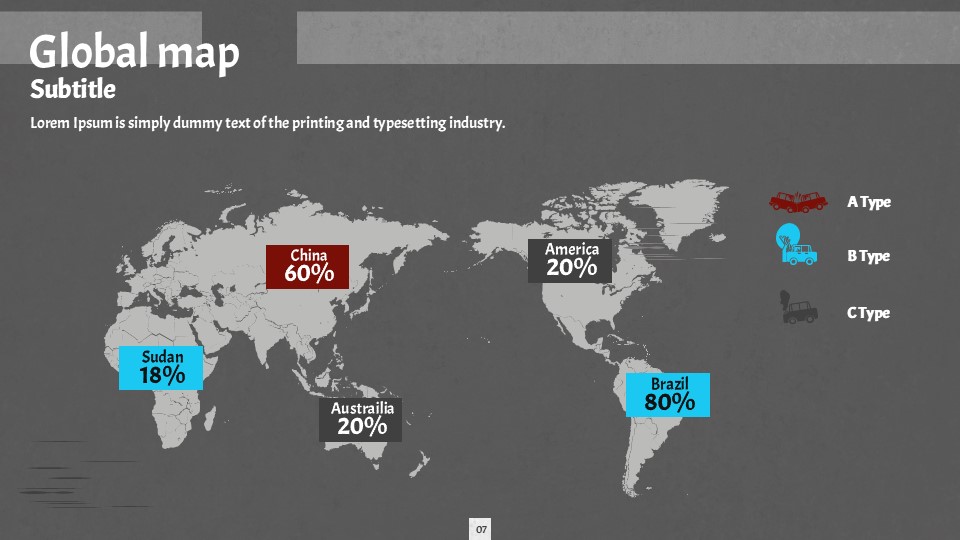
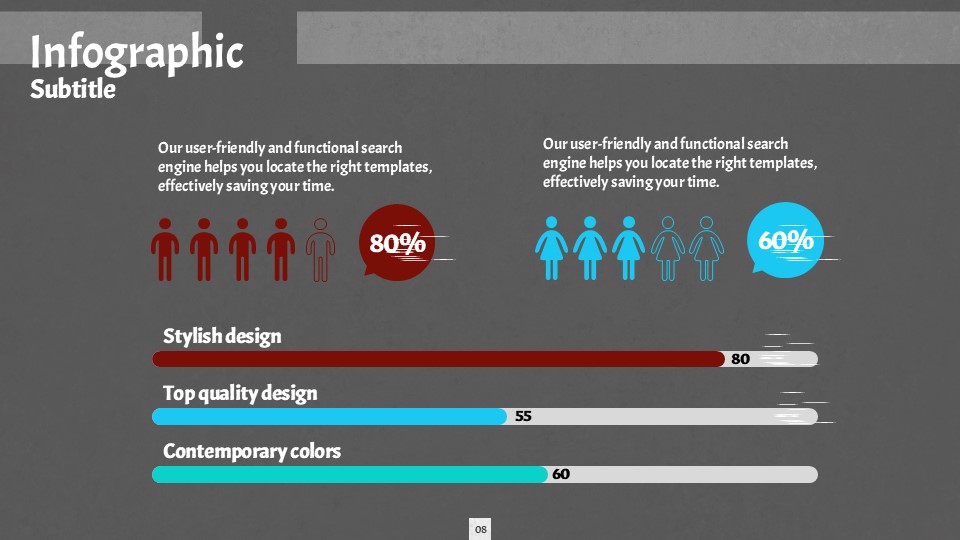
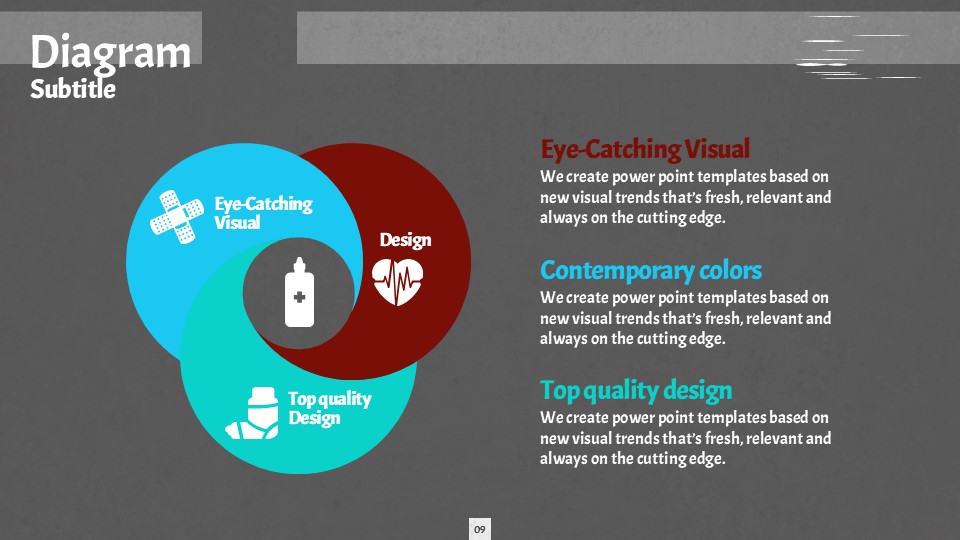
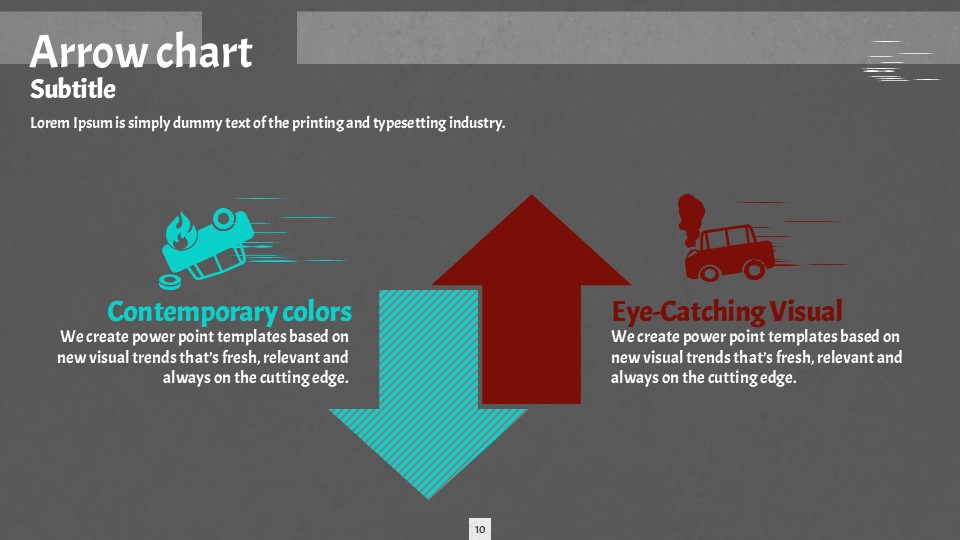
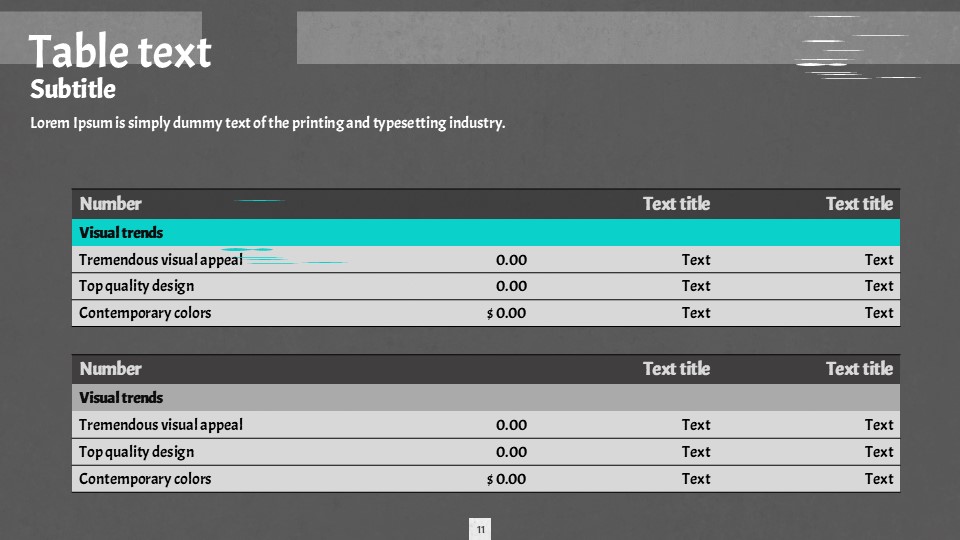
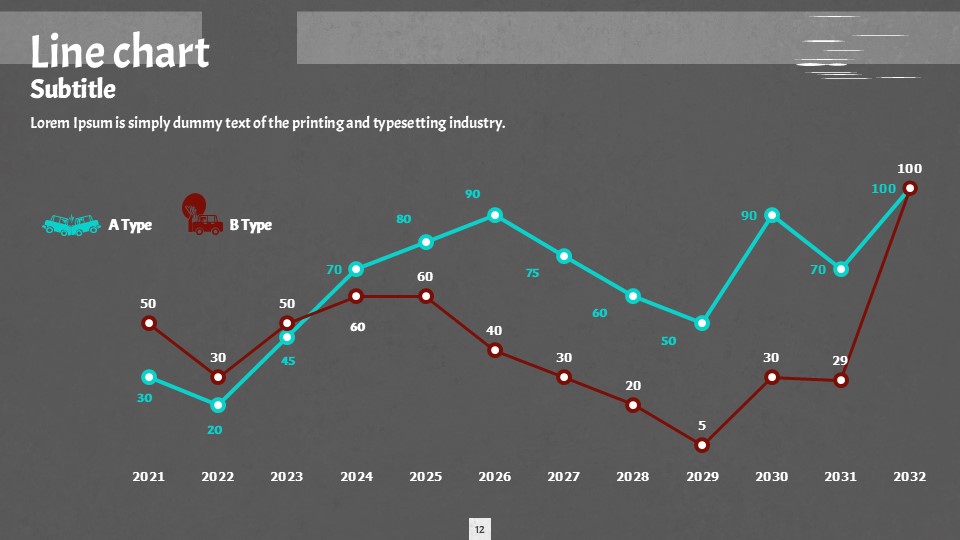
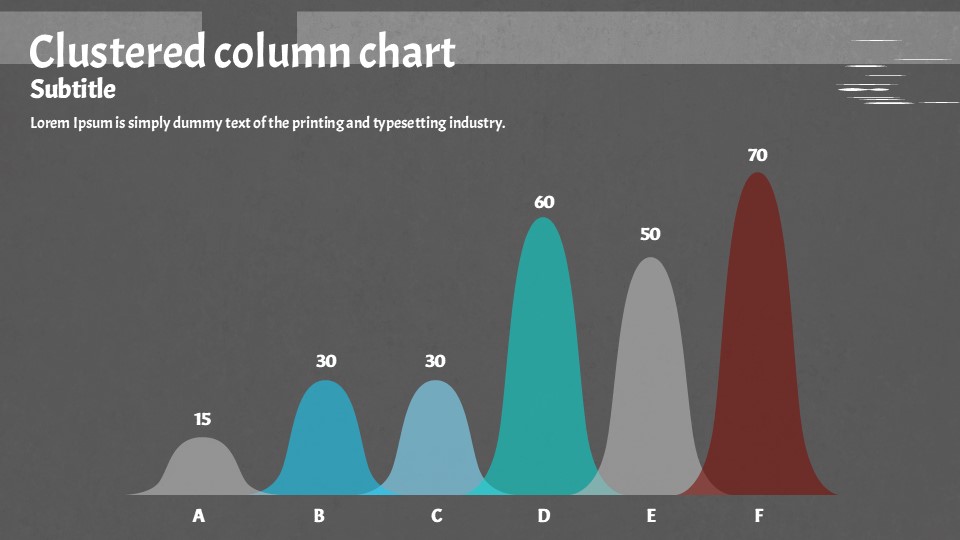
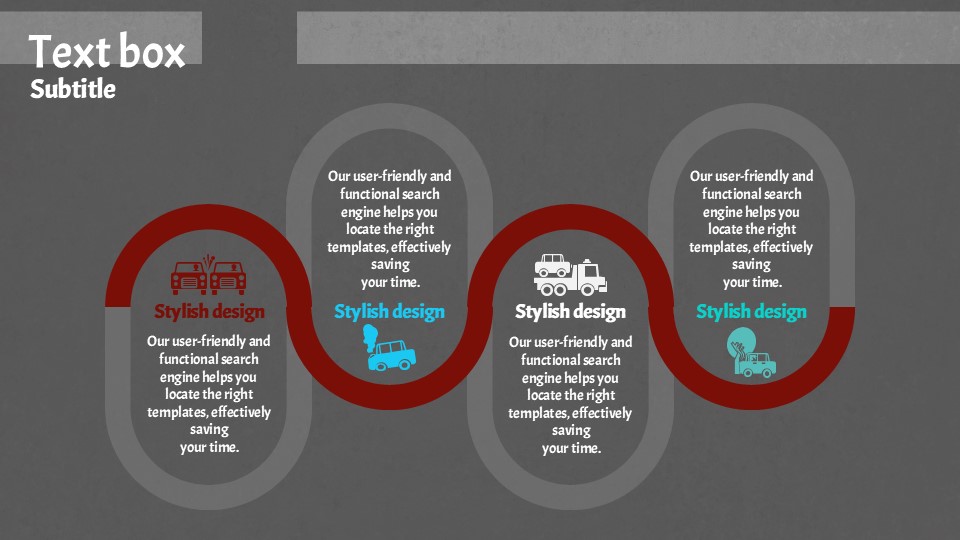
This PowerPoint template combines deep red and teal accent colors with a dark gray body layout to deliver high-impact visuals for car accident and traffic safety presentations. The cover slide features a flat-illustration-style vehicle collision graphic set against a textured red background, immediately capturing audience attention. The 20-slide deck includes a variety of data visualization slides: pie charts, donut charts, a triangular cycle diagram, a US regional map infographic, and a global world map with country-level percentage data. All chart elements and icons are fully editable vector objects, making it easy to replace placeholder figures with your actual statistics. Delivered in PPTX format at 16:9 widescreen ratio, this presentation template is ready to use for insurance loss ratio reports, road safety campaigns, accident analysis briefings, and automotive industry presentations. Simply open the file, update the text and data, and your professional slide deck is complete.
Usage Points
-
Main Usage
Designed for presenting car accident statistics, insurance loss analysis, road safety campaigns, and automotive industry data. The bold red-and-teal color scheme ensures your key messages stand out in any boardroom or conference setting.
-
How to Use
Open the PPTX file, replace the title and body text on each slide, and update the pie chart and donut chart values with your real data. Insert regional figures into the US map slide and country-level percentages into the global map slide to complete your presentation.
-
Recommended For
Insurance analysts, traffic safety researchers, government transportation officials, automotive industry professionals, and university students presenting accident-related data who need a visually compelling and data-rich slide deck.
-
Slide Structure
Cover slide (vehicle collision illustration + title) / Table of contents (4-item INDEX) / Triangular cycle diagram / Pie chart slide (3-value comparison) / Donut chart analysis slide / US regional map infographic / Global world map data slide — 20 slides total in 16:9 widescreen format.


