Gauge Chart and Analytical Text – Visual Insights
RJ0600047_7
- Last Update 07/03/2025
- File Size 1.2MB
- # of Slides 2
- File Format PPTX
- Slide Ratio 16:9
- Color
Keywords
About the Product
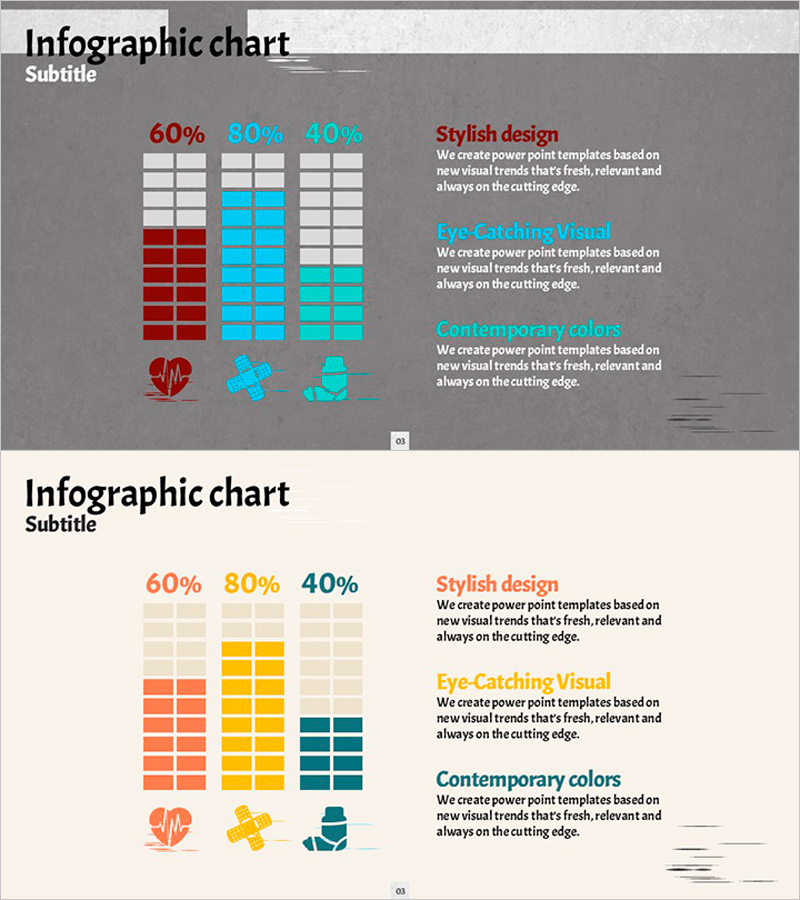
A PowerPoint slide deck featuring gauge charts that intuitively display data ratios. Three metrics (60%, 80%, 40%) are visualized using red, blue, and cyan gauges, making it ideal for performance analysis, goal achievement tracking, and competency assessment presentations. Each gauge is paired with title and descriptive text areas, enabling immediate use in business presentations. The combination of a gray background with colorful gauge elements creates a professional information visualization slide suitable for executive reports and analytical presentations.
Usage Points
-
Main Usage
Visualize ratio-based data such as performance metrics, goal achievement rates, competency assessments, and analytical results using gauge charts. The text areas beside each gauge allow you to add detailed explanations, making data context clear and compelling to your audience.
-
How to Use
Use in executive reports, quarterly performance presentations, project status updates, marketing campaign effectiveness analysis, and educational seminars to explain quantitative data intuitively. Simply edit the gauge values and text with your own data and use immediately in your presentation.
-
Recommended For
Recommended for executives, marketing managers, project managers, data analysts, and educators who need to explain quantitative performance visually. Applicable to quarterly reports, performance evaluation presentations, strategic planning meetings, and various business scenarios.
-
Slide Structure
Two-slide deck with three gauge charts (60%, 80%, 40%) on each slide, accompanied by title, subtitle, and descriptive text areas. Gray background with red, blue, and cyan gauges; visual variety enhanced with icons (heartbeat, cross, cube shapes).
Related Products
-

Organization Headcount Doughnut Chart – Visualizing Operational Plans
#Operational Plan #Graph #Production and Technology Development Strategy
-

3 Radial Charts and Analysis – Competitor and Market Trends
#Market and Competitor Analysis #Diagram #Graph
-

Travel App Business Future Outlook Visual Slide with Step-by-Step Schedule
#Business Strategy #Market and Competitor Analysis #Diagram
-

Vertical Bar Graph Template for Business Plan
#Market and Competitor Analysis #Graph #Competitor Analysis
