Latest Numeric Highlight Bar Chart – Visualizing Business Growth
RJ0600047_17
- Last Update 07/03/2025
- File Size 1.2MB
- # of Slides 2
- File Format PPTX
- Slide Ratio 16:9
- Color
Keywords
About the Product
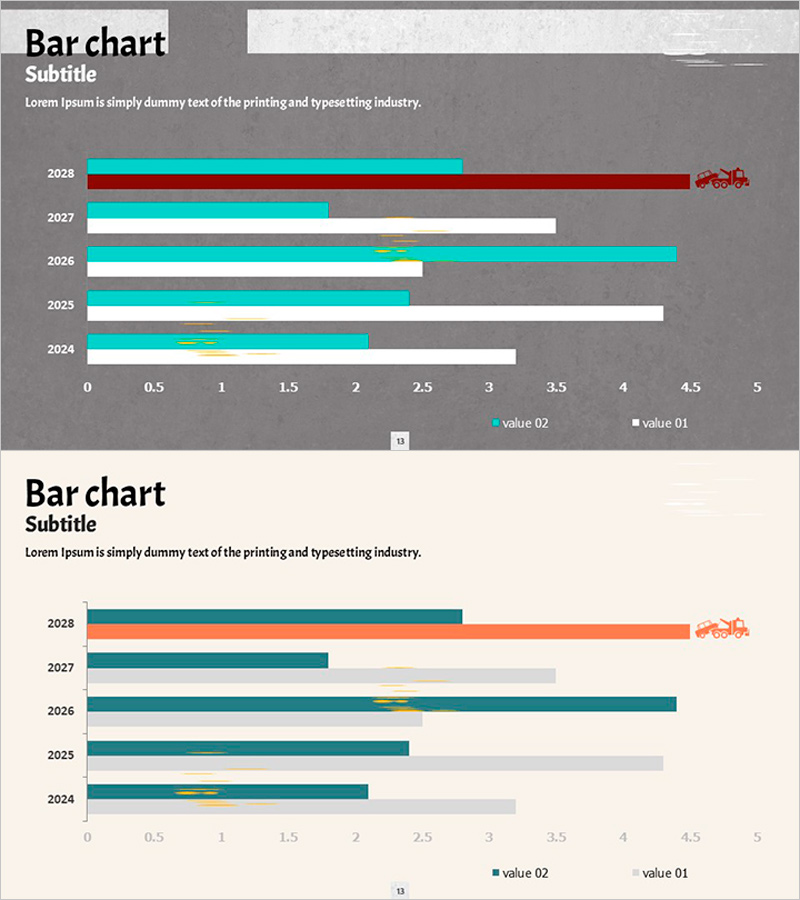
A horizontal bar chart PowerPoint slide visualizing business growth trends from 2024 to 2028 across five consecutive years. The slide features two data series in teal and gray colors, enabling clear year-over-year comparison and immediate recognition of performance changes. The layout is designed for quick data comprehension in business presentations, financial reports, performance reviews, and marketing analytics. Fully editable with customizable colors, values, and labels for seamless integration into corporate presentations.
Usage Points
-
Main Usage
Compare year-over-year business metrics across five years using two data series to highlight performance trends and growth patterns. Ideal for quarterly earnings presentations, annual business reviews, marketing ROI analysis, and strategic planning discussions where quantitative data drives decision-making.
-
How to Use
Input actual numerical values for each year and data series; bar lengths automatically adjust proportionally. Assign teal series to primary metrics and gray series to comparative benchmarks to emphasize correlations. All colors, fonts, and values are fully editable in PowerPoint without requiring design skills.
-
Recommended For
Finance managers, marketing directors, business analysts, and executives presenting performance metrics to stakeholders. Suitable for investor presentations, board meetings, client pitches, and internal team reviews where credible data visualization strengthens messaging and builds audience confidence.
-
Slide Structure
Two-slide deck. Slide 1 features a gray background with teal, dark red, and gray bars representing five years of data, with an icon accent on 2028. Slide 2 uses a beige background with teal and gray bars showing the same data, providing a color variation option for different presentation contexts.
Related Products
-

Market Share Status of Premium Cafe Industry
#Market and Competitor Analysis #Graph #Market Status
-

Negative Vertical Bar Chart – Emphasis on Financial Performance
#Financial Plans and Performance #Graph #Budget
-

Visual Trend Analysis through Data Visualization – The Power of Stunning Design
#Company Introduction #Graph #Key Achievements
-

Space Theme Market Share Donut Pie Chart
#Business Introduction #Market and Competitor Analysis #Graph
