Investigation on the Ratio of Male and Female Traffic Accidents – Gender Analysis
RJ0600047_12
- Last Update 07/03/2025
- File Size 1.2MB
- # of Slides 2
- File Format PPTX
- Slide Ratio 16:9
- Color
Keywords
About the Product
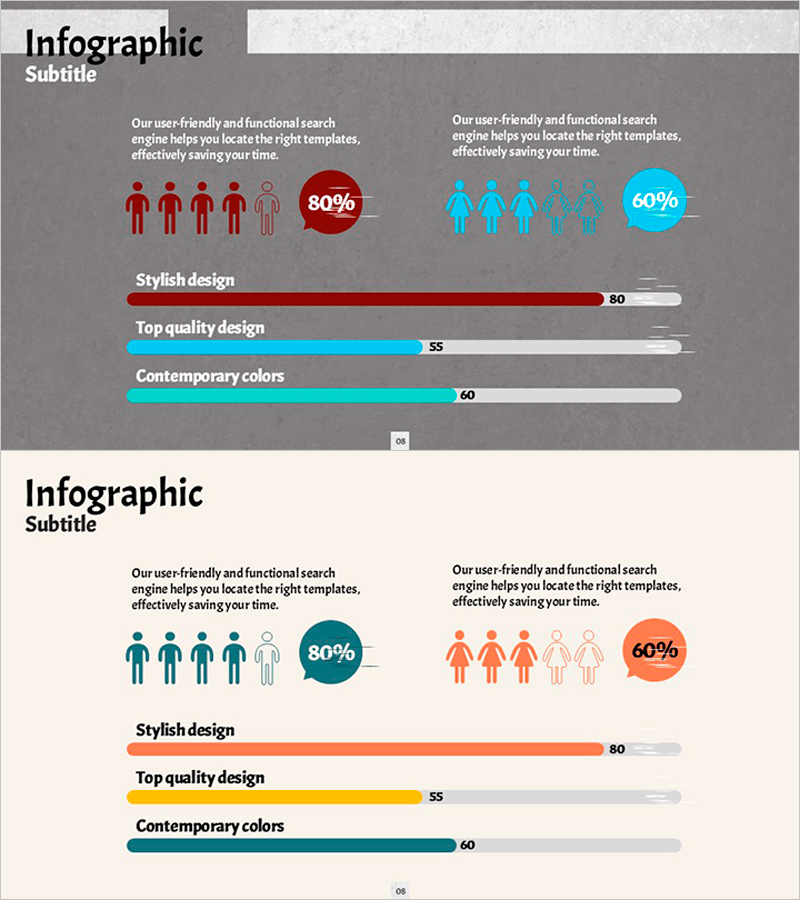
A 2-slide infographic PowerPoint presentation comparing male and female traffic accident ratios with visual data analysis. The slides use human icons, circular percentage charts, and horizontal bar graphs to represent gender-based statistics intuitively. The top slide features a dark gray background with deep red and cyan accents for gender differentiation, while the bottom slide uses a beige background with teal and orange tones for the same data. Each slide includes 2 text description areas, 5 human icons, 1 circular percentage chart, and 3-item horizontal bar graphs, making it ready for immediate use in customer analysis, market research, and gender-based statistical presentations.
Usage Points
-
Main Usage
Visualize male and female traffic accident ratios, gender statistics, and customer analysis data at a glance. Human icons represent population composition while circular charts and bar graphs simultaneously display numerical data, enhancing audience comprehension.
-
How to Use
Apply to market research reports, gender analysis presentations, and customer statistics documents as a data comparison section. Enter your explanations in text areas and edit chart values to match your actual data. Choose between 2 color theme versions that best fit your presentation tone.
-
Recommended For
Ideal for marketing team customer analysis presentations, government statistical agency reports, insurance company risk analysis documents, and traffic safety campaign materials. Applicable to any data analysis document requiring gender-based comparisons.
-
Slide Structure
Each slide contains 2 text description areas at the top, 5 human icons (4 male and 1 female or vice versa) with 1 circular percentage chart in the center, and a 3-item horizontal bar graph at the bottom. All text, icons, and charts are fully editable with 2 color theme options provided.
Related Products
-

Collaboration Silhouette Diagram – Visual Tool for Customer Analysis
#Market and Competitor Analysis #Graph #Other
-

Customer Evaluation and Feedback on Renewable Energy Business - Doughnut Chart
#Market and Competitor Analysis #Customer Success Stories #Graph
-

User Analysis Graph Visualization – Market and Customer Insights
#Market and Competitor Analysis #Graph #Other
-

Old Man Silhouette Donut Circle Graph – Customer Analysis
#Market and Competitor Analysis #Graph #Other
