Dynamic Area Charts - Comparison and Analysis
RJ0600047_8
- Last Update 07/03/2025
- File Size 1.2MB
- # of Slides 2
- File Format PPTX
- Slide Ratio 16:9
- Color
Keywords
About the Product
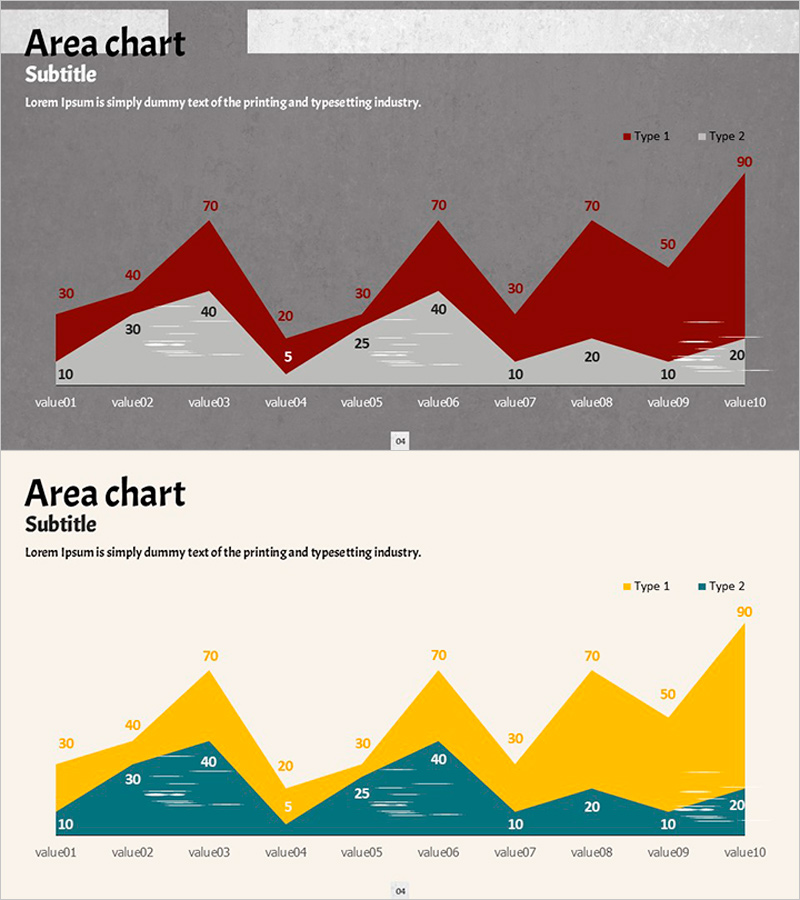
A PowerPoint slide set that visualizes two data series using an area chart format. Against a dark gray background, deep red and light gray areas overlap to intuitively show numerical changes over time and comparisons between series. With 10 data points (value01 through value10), Type 1 and Type 2 trends are displayed simultaneously, with each value clearly labeled for immediate use in presentations. Area charts are highly effective for emphasizing cumulative data or composition changes over time, making them ideal for business reports, marketing analysis, and financial presentations.
Usage Points
-
Main Usage
Optimized for comparing and emphasizing numerical changes across two or more data series over time. Effectively communicates cumulative data composition changes or competitive performance trends through intuitive visual representation, with overlapping areas creating strong visual emphasis.
-
How to Use
Apply to performance analysis sections in business reports, market share trend visualization in marketing plans, revenue and cost progression in financial presentations, and quarterly performance comparisons in strategy reports. The dark gray background ensures clear readability in projector environments, while numeric labels on each data point enable precise information delivery.
-
Recommended For
Recommended for finance and accounting teams presenting quarterly results, marketing teams analyzing campaign performance, sales teams reporting sales trends, executive strategy presentations, and investor relations meetings. Suitable for all business presentations involving multi-series data analysis.
-
Slide Structure
Two-slide set featuring dark gray and beige background options. Each slide displays 10 data points (value01–value10) on the X-axis with Type 1 (upper area) and Type 2 (lower area) on the Y-axis. Includes legend and numeric labels for immediate data input and presentation use.
Related Products
-

Curved Theme Purple Pie Chart for Business Strategy and Vision Presentation
#Company Introduction #Business Vision and Strategy #Diagram
-

Comparison of Change Curves – Market and Competitor Analysis
#Market and Competitor Analysis #Graph #Market Status
-

Simple Circle Pie Chart Template - Market Share Analysis
#Market and Competitor Analysis #Marketing Plan and Strategy #Graph
-

Data Analysis PPT for Households with Pets
#Business Strategy #Market and Competitor Analysis #Graph
