A Study on the Rate of Traffic Accidents by Country – Global Data Visualization
RJ0600047_11
- Last Update 07/03/2025
- File Size 1.6MB
- # of Slides 2
- File Format PPTX
- Slide Ratio 16:9
- Color
Keywords
About the Product
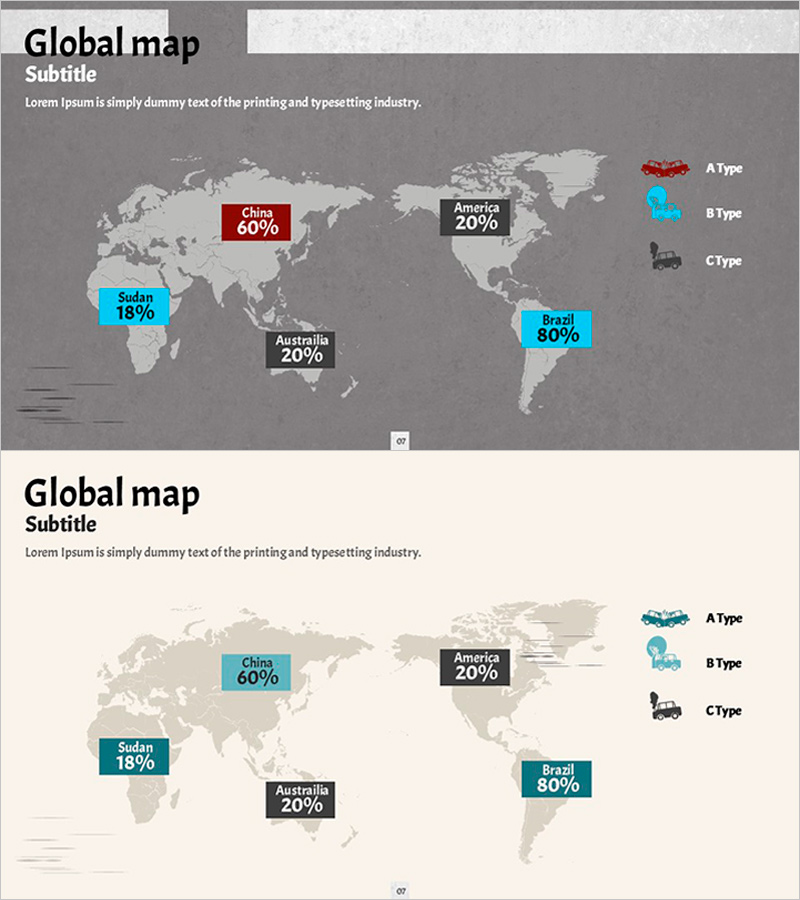
A 2-slide PowerPoint set that visualizes country-level statistical data on a global map. Includes a dark gray background version and a light beige background version, each displaying regional figures with color-coded boxes and percentages. Compare key countries—China, Brazil, Sudan, America, Australia—at a glance, with category icons (A, B, C types) in the right legend. Perfect for presentations, reports, and marketing plans that need to communicate global market status, regional performance, and international business data with impact.
Usage Points
-
Main Usage
Visualize international business, market analysis, and global network status using map-based layout to present decision-making insights. Enable audience to compare regional and country-level performance, market share, and size at a single glance.
-
How to Use
Use in investor presentations, market analysis meetings, and global strategy discussions to overlay regional data on the map. Replace country box values and colors with your own data, and adjust legend icons to match your categories.
-
Recommended For
Executives, marketing teams, sales teams, strategic planning teams, and international business managers. Recommended for anyone presenting global market status, regional revenue, country-level customer distribution, or international partnership updates.
-
Slide Structure
Slide 1: Dark gray background + world map + 5 country data boxes (China 60% red, Brazil 80% cyan, Sudan 18% cyan, America 20% black, Australia 20% black) + right legend with A, B, C type icons. Slide 2: Light beige background + identical layout with adjusted color tones. Both slides include title, subtitle, and description text input areas.
Related Products
-

Country-Specific EV Adoption Strategy
#Company Introduction #Marketing Plan and Strategy #Diagram
-

Modern Blue Presentation World Map – Market Analysis and Global Network
#Company Introduction #Market and Competitor Analysis #Other
-

Gourmet Template Map – Global Network Visualization
#Company Introduction #Diagram #Other
-

Fruit Importers and Proportions – Global Distribution Strategy
#Company Introduction #Marketing Plan and Strategy #Graph
