Traffic Accident Type Diagram – Prevention and Analysis
RJ0600047_5
- Last Update 07/03/2025
- File Size 1.2MB
- # of Slides 2
- File Format PPTX
- Slide Ratio 16:9
- Color
Keywords
- #Content-Based Slides
- #Design-Based Slides
- #Business Vision and Strategy
- #Operational Plan
- #Diagram
- #Business Background and Necessity
- #Business Support Plan
- #Cluster
- #Spread
- #Chain Diagram
- #Centralized Diagram
- #16:9
- #4-section radial diagram PowerPoint
- #traffic accident analysis slide
- #radial diagram template
- #accident type classification
- #PowerPoint diagram slide
- #accident prevention presentation
About the Product
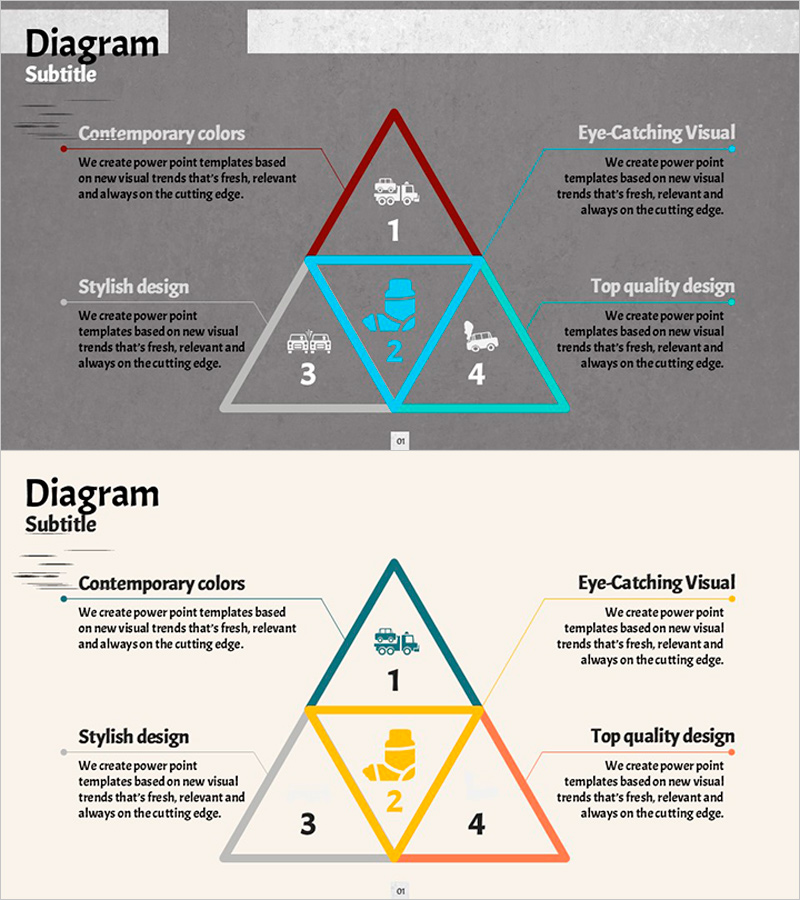
A radial diagram PowerPoint slide designed for traffic accident prevention and analysis. The structure radiates from a central hub to four directional sections, enabling intuitive classification and visualization of accident types. Distinct color coding—red, blue, gray, and cyan—clearly differentiates each category, while icons symbolically represent vehicles and scenarios. Formatted in 16:9 widescreen with 2 slides, this presentation template is ready for immediate use in reports, operational plans, and business vision sections.
Usage Points
-
Main Usage
Classifies and analyzes traffic accident types by radiating from a central point to four directional sections, systematically explaining characteristics and prevention measures for each type. Enables at-a-glance comparison of accident causes, damage scale, prevention strategies, and management approaches.
-
How to Use
Set the core topic at the center, then assign accident types (rear-end collision, side-impact, falling objects, pedestrian accidents, etc.) to each of the four sections. Edit icons and text in each section to represent specific scenarios, and use color differentiation to indicate priority or severity levels. Present each section sequentially during the presentation to enhance audience comprehension.
-
Recommended For
Ideal for traffic safety officers, operations management teams, business planning presentations, safety training seminars, and risk management reports. Applicable to transportation companies (logistics, delivery, bus, taxi services) for safety policy development, insurance companies for accident analysis, and government agencies for traffic safety campaigns.
-
Slide Structure
Two-slide composition: the first slide features four triangles in red, blue, gray, and cyan radiating toward the center, with vehicle icons and numbers (1–4) positioned within each triangle. The second slide presents a variation with yellow and orange accent lines added to the same structure. Each section consists of independently editable text boxes and icons for customization.
Related Products
-

Diffusion Diagram of the Power of Learning – Visualizing Knowledge Spread
#Business Vision and Strategy #Operational Plan #Diagram
-

Business Area Diffusion Diagram – Connection and Cluster
#Company Introduction #Business Introduction #Diagram
-

Nature Protection Follow-Up Maintenance Plan Infographic
#Product/Service Introduction #Operational Plan #Diagram
-

Closed Diagram of Production and Technology Development Strategies for Agricultural Development
#Operational Plan #Diagram #Production and Technology Development Strategy
