Traffic Accident Analysis Diagram – Risk Management Strategy
RJ0600047_9
- Last Update 07/03/2025
- File Size 1.2MB
- # of Slides 2
- File Format PPTX
- Slide Ratio 16:9
- Color
Keywords
- #Content-Based Slides
- #Design-Based Slides
- #Business Introduction
- #Risk Management and Regulatory Compliance
- #Diagram
- #Business Overview
- # Risk Management Strategy
- #Cluster
- #Spread
- #Chain Diagram
- #Centralized Diagram
- #16:9
- #radial diagram PowerPoint slide
- #4-section analysis template
- #risk management presentation
- #circular diagram slide design
- #process evaluation PowerPoint template
About the Product
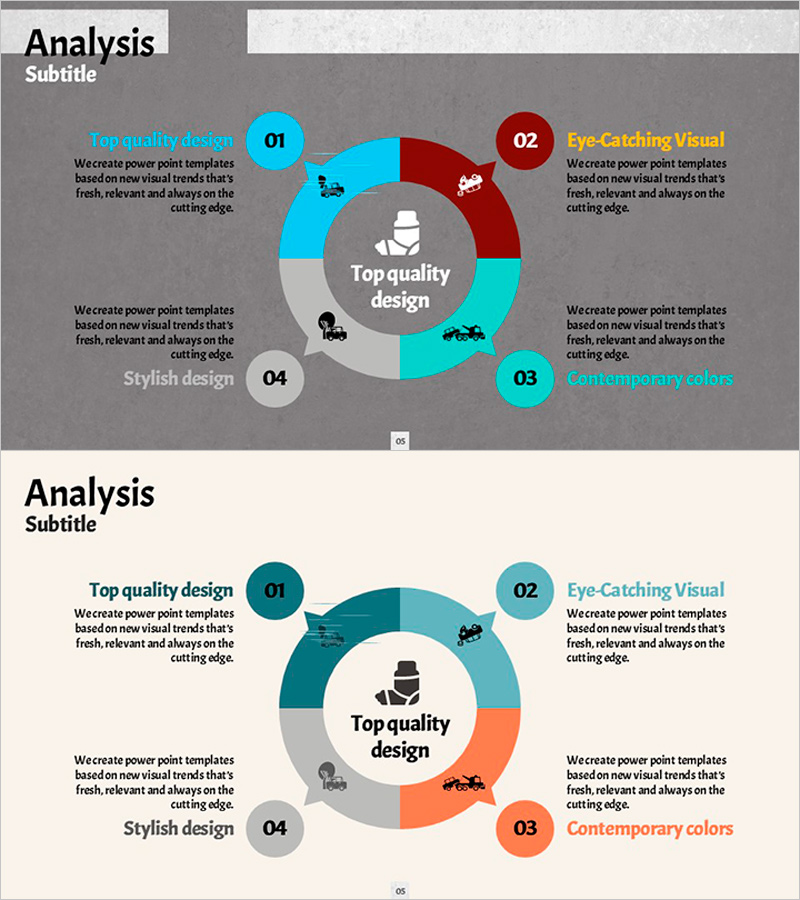
A radial diagram PowerPoint slide with four sections arranged around a central circle, featuring distinct color blocks in blue, red, cyan, and gray tones. Each section is numbered (01–04) with accompanying icons and text areas, creating clear visual hierarchy for multi-perspective analysis. This design is ideal for risk management, case analysis, process evaluation, and strategic decision-making presentations. The slide deck includes two layout variations with different color schemes, optimized for 16:9 widescreen format, allowing immediate customization for business presentations.
Usage Points
-
Main Usage
Presents four related elements or perspectives around a central concept, enabling simultaneous comparison and analysis. Ideal for risk management strategies, case studies, process evaluations, and multi-criteria decision-making frameworks in executive and strategic presentations.
-
How to Use
Enter the core topic in the center circle, then populate each of the four sections with analysis items, alternatives, or evaluation criteria. Customize text and icons within color-coded areas to enhance visual emphasis. Choose between two color variations to match presentation tone and audience context.
-
Recommended For
Recommended for executives, managers, and consultants presenting risk management, quality assurance, and operational strategies. Also effective for educational seminars explaining complex concepts from multiple angles, and marketing strategy sessions requiring multi-factor analysis.
-
Slide Structure
Central circle with four sections arranged radially in clockwise order. Each section contains a numbered label (01–04), color block, icon, and text area. Slide 1 features blue, red, cyan, and gray tones; Slide 2 offers cyan, orange, and gray variations for design flexibility.
Related Products
-

Detailed Plan Diffusion Diagram – Business Strategy and Direction
#Business Introduction #Business Vision and Strategy #Diagram
-

Survival Swimming Diagram – Risk Management and Cluster Strategy
#Business Vision and Strategy #Risk Management and Regulatory Compliance #Diagram
-

Connection Infographic Diagram – Business Overview and Revenue Model
#Business Introduction #Diagram #Business Overview
-

Sports Infographic Strategy Diagram – Vision and Competitiveness
#Business Introduction #Business Vision and Strategy #Diagram
