Traffic Accident Process Diagram – Operational Planning and Implementation System
RJ0600047_4
- Last Update 07/03/2025
- File Size 1.2MB
- # of Slides 2
- File Format PPTX
- Slide Ratio 16:9
- Color
Keywords
- #Content-Based Slides
- #Design-Based Slides
- #Business Strategy
- #Operational Plan
- #Diagram
- #Implementation Framework
- #Business Processes
- #Cluster
- #Closed Cluster Diagram
- #Chain Diagram
- #16:9
- #process diagram PowerPoint
- #4-step flowchart template
- #connected flow diagram slide
- #operational planning visualization
- #business process template PowerPoint
About the Product
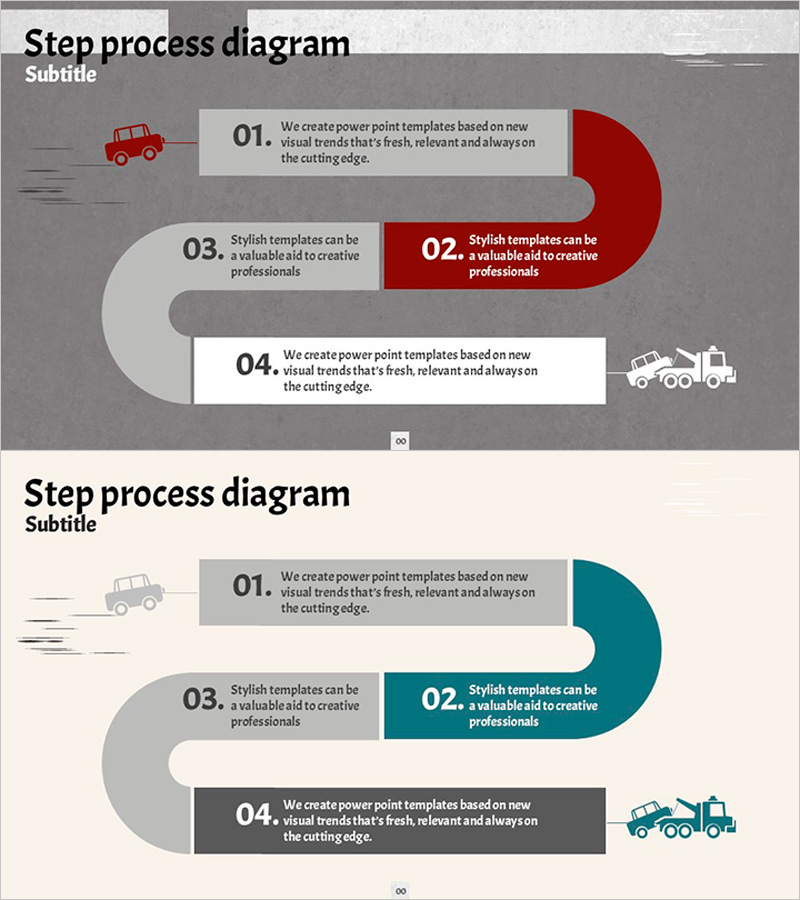
A 4-step process diagram PowerPoint slide that visualizes operational planning and implementation workflows. The design features left-side icons (car and truck) connected to numbered boxes (01–04) via curved connector lines, clearly showing sequential progression. The color scheme uses red, teal, and gray to highlight key stages, with dedicated text areas in each step for entering business strategy, operational procedures, and execution plans. Delivered in 16:9 widescreen format across 2 slides, ready for immediate use in presentations, reports, and planning documents.
Usage Points
-
Main Usage
Designed to visually represent sequential processes, workflow stages, and business execution roadmaps. Ideal for presenting accident response procedures, operational planning phases, project implementation timelines, quality assurance steps, and any initiative requiring step-by-step progression.
-
How to Use
Enter step names, descriptions, responsible parties, and timelines in each numbered box. Customize colors to indicate priority levels or replace icons to match your industry and topic. The curved connector lines clearly show relationships between stages and maintain visual flow.
-
Recommended For
Operations managers, business planners, project leads, quality assurance teams, and training professionals. Perfect for business plans, operational manuals, proposals, progress reports, and educational presentations where process explanation is essential.
-
Slide Structure
2-slide set. Each slide displays 4 connected nodes (01–04) linked by curved lines. First slide emphasizes red accent; second slide features teal accent, offering color variation of the same diagram. Each node includes editable text areas for step details.
Related Products
-

Efficient Business Strategy Presentation through the Work System Box
#Business Strategy #Operational Plan #Diagram
-

Basic Skincare Steps Guide – Visual Process Made Easy
#Business Strategy #Operational Plan #Diagram
-

Preparation Procedure for the Wedding Hall – Roadmap for Weddings
#Business Strategy #Operational Plan #Diagram
-

Connection Diagram: Key Elements of Speech Concept
#Business Strategy #Operational Plan #Diagram
