Green Orange Table Slide – Financial Insights at a Glance
RJ0600047_15
- Last Update 07/03/2025
- File Size 1.2MB
- # of Slides 2
- File Format PPTX
- Slide Ratio 16:9
- Color
Keywords
About the Product
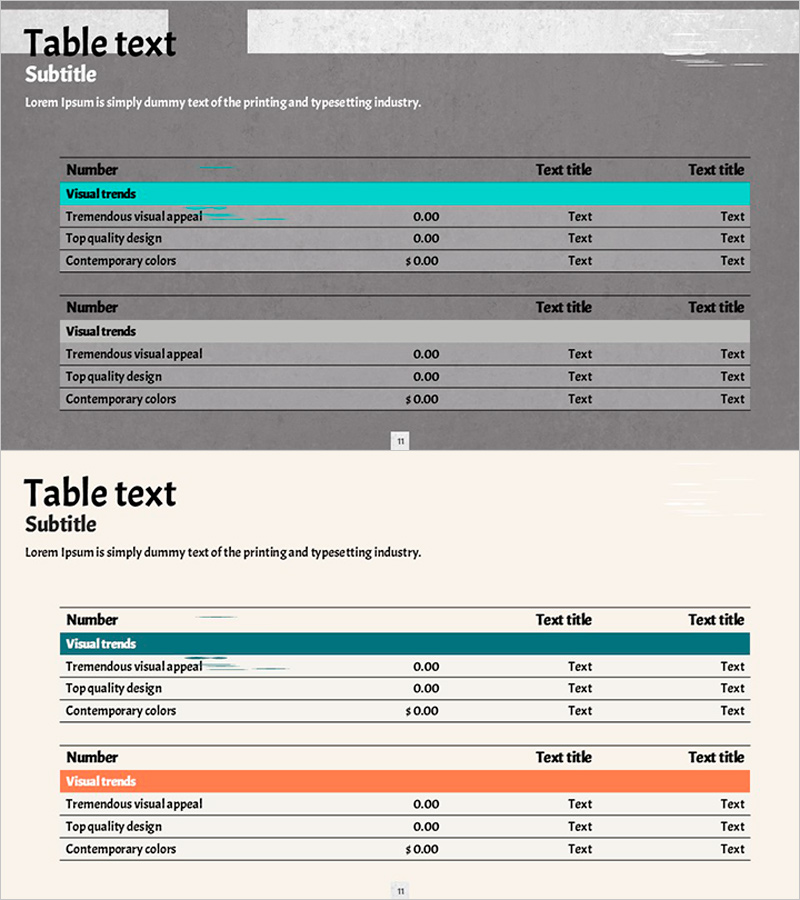
A horizontal table PowerPoint slide designed to present financial data and business metrics with clarity and structure. Features teal and orange header rows that divide content into two distinct sections, enabling side-by-side comparison of numerical values and text information. Ideal for financial statements, revenue and profit analysis, cash flow reports, and performance indicators in executive presentations. The 16:9 widescreen format and PPTX file type allow full customization and seamless integration into business decks.
Usage Points
-
Main Usage
Present quantitative data such as financial status, revenue and profit figures, cash flow, and performance metrics in a structured table format. The color-coded header rows create visual hierarchy between sections, while the row-column structure facilitates effective comparative analysis across items and categories.
-
How to Use
Input financial figures, performance indicators, cost items, and other data into each cell. The teal and orange header colors can be used to distinguish sections or compare periods and departments. Combine text and numerical data to increase information density. Suitable for corporate reports, investor presentations, and executive briefings.
-
Recommended For
CFOs, finance managers, business strategists, investor relations professionals, and consultants who need to communicate quantitative analysis and reporting. Applicable to quarterly and annual financial presentations, business performance reports, investor pitch decks, and internal management meetings.
-
Slide Structure
Two-slide set. Each slide contains a 3-column by 4-row horizontal table with header row (Number, Text title, Text title) and three data rows. First slide features teal header; second slide features orange header, creating visual contrast between sections for enhanced readability.
Related Products
-

Green & Gray Template Wide Table – Visualizing Financial Plans and Performance
#Financial Plans and Performance #Diagram #Cash Flow Statement
-

Spring Background Table – Visualizing Financial Performance!
#Financial Plans and Performance #Diagram #Cash Flow Statement
-

Origami Presentation Template Section Table – Showcase Financial Performance
#Financial Plans and Performance #Diagram #Cash Flow Statement
-

Annual Sales and Profit Analysis Table – Key to Financial Planning
#Financial Plans and Performance #Diagram #Cash Flow Statement
