
Blockchain Presentation Template – Innovative and Sleek Design
J0400064
- Last Update 08/03/2025
- File Size 21.6MB
- # of Slides 30
- File Format PPTX
- Slide Ratio 16:9
- Color
Slide Preview


Keywords
About the Product
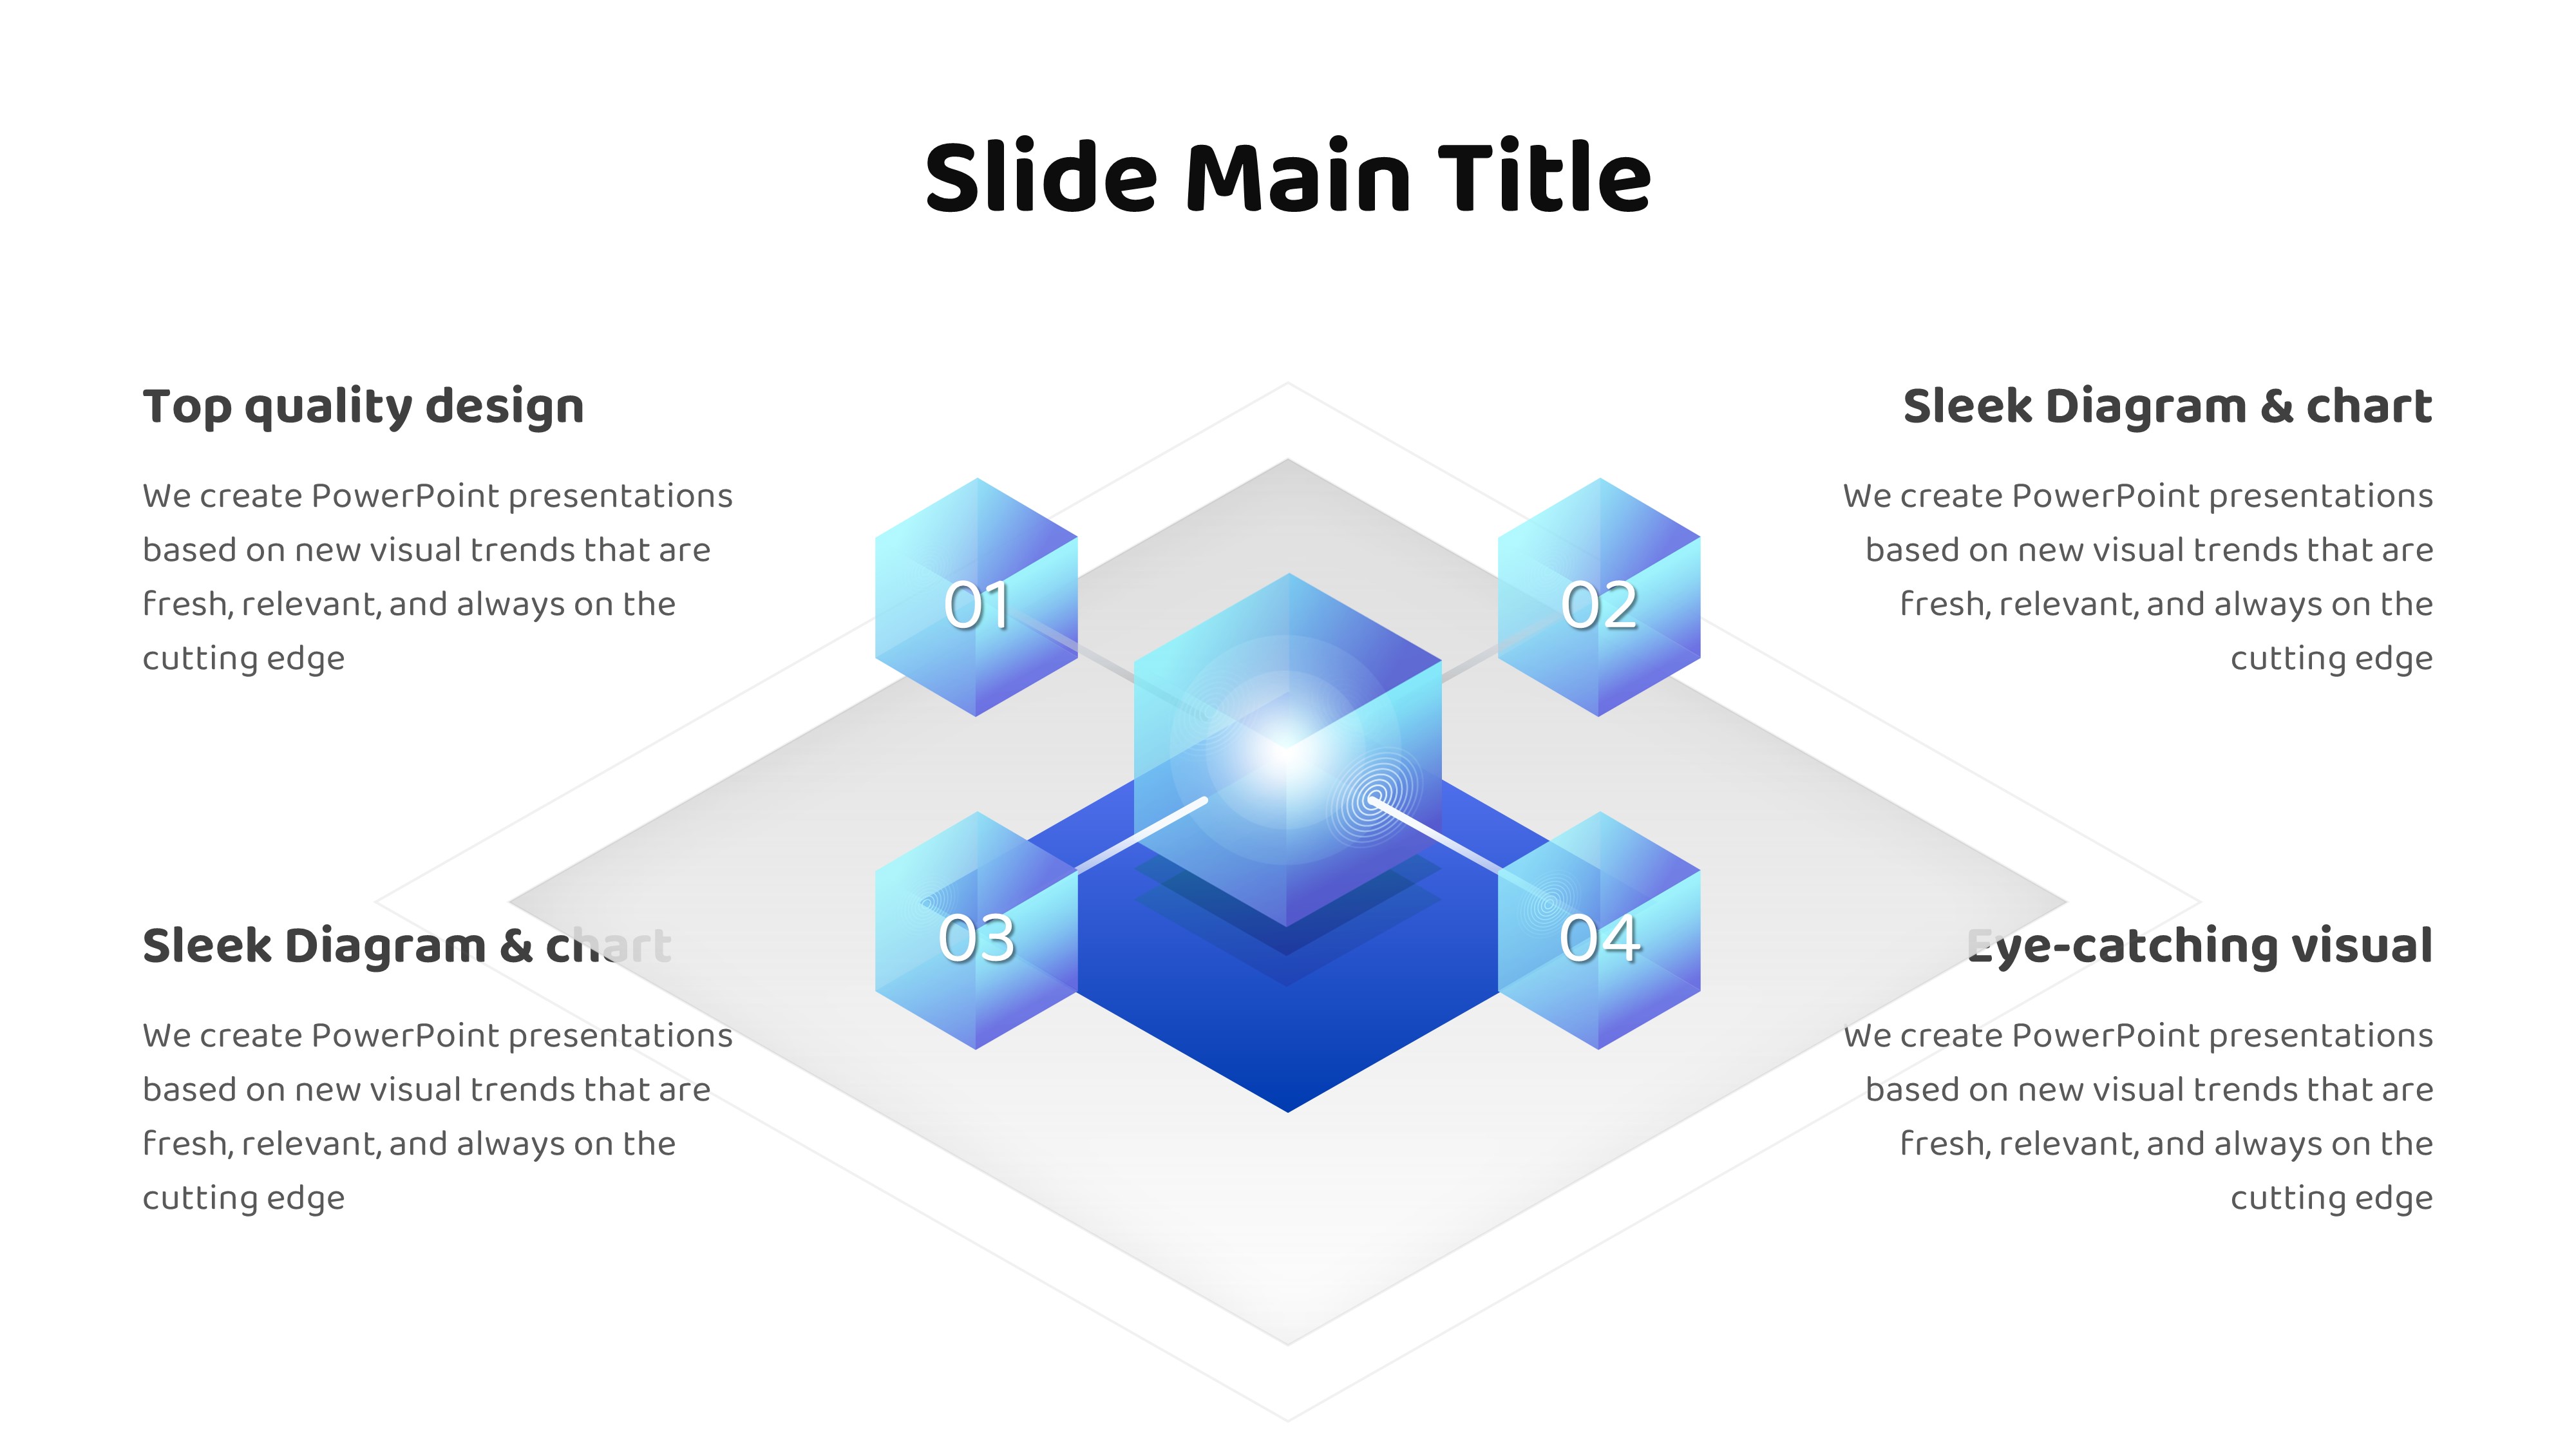
A professional PowerPoint template designed for blockchain technology, fintech, and IT presentations, featuring a complete 30-slide deck ready for immediate use. The template opens with a bold royal blue background paired with a cyan-and-purple 3D isometric blockchain node illustration as the hero visual, instantly communicating technological innovation. A two-tone layout alternates between dark blue slides for high-impact messaging and clean white slides for detailed data, creating a natural rhythm throughout the presentation. Included layouts cover hexagon line-icon diagrams, KPI metric cards, line and bar charts, and four-column icon cards, giving you everything needed to cover service introductions, market data, and technical architecture in a single cohesive deck. Delivered in fully editable PPTX format, all text, colors, and images can be customized to match your brand. Ideal for blockchain pitch decks, investor IR materials, tech conference presentations, and startup demo days.
Usage Points
-
Main Usage
Designed to communicate blockchain technology concepts, fintech service overviews, and IT startup value propositions with visual clarity and professional credibility in investor meetings, conferences, and demo days.
-
How to Use
Download the PPTX file and open it in PowerPoint or Keynote. Replace placeholder text, numbers, and images with your own content. Use dark blue slides for key messages and white slides for supporting data to maintain a clear visual flow throughout your presentation.
-
Recommended For
Blockchain and cryptocurrency startup founders, fintech product managers, IT company marketing and strategy teams, developers preparing investor IR decks, and speakers presenting at technology conferences or seminars.
-
Slide Structure
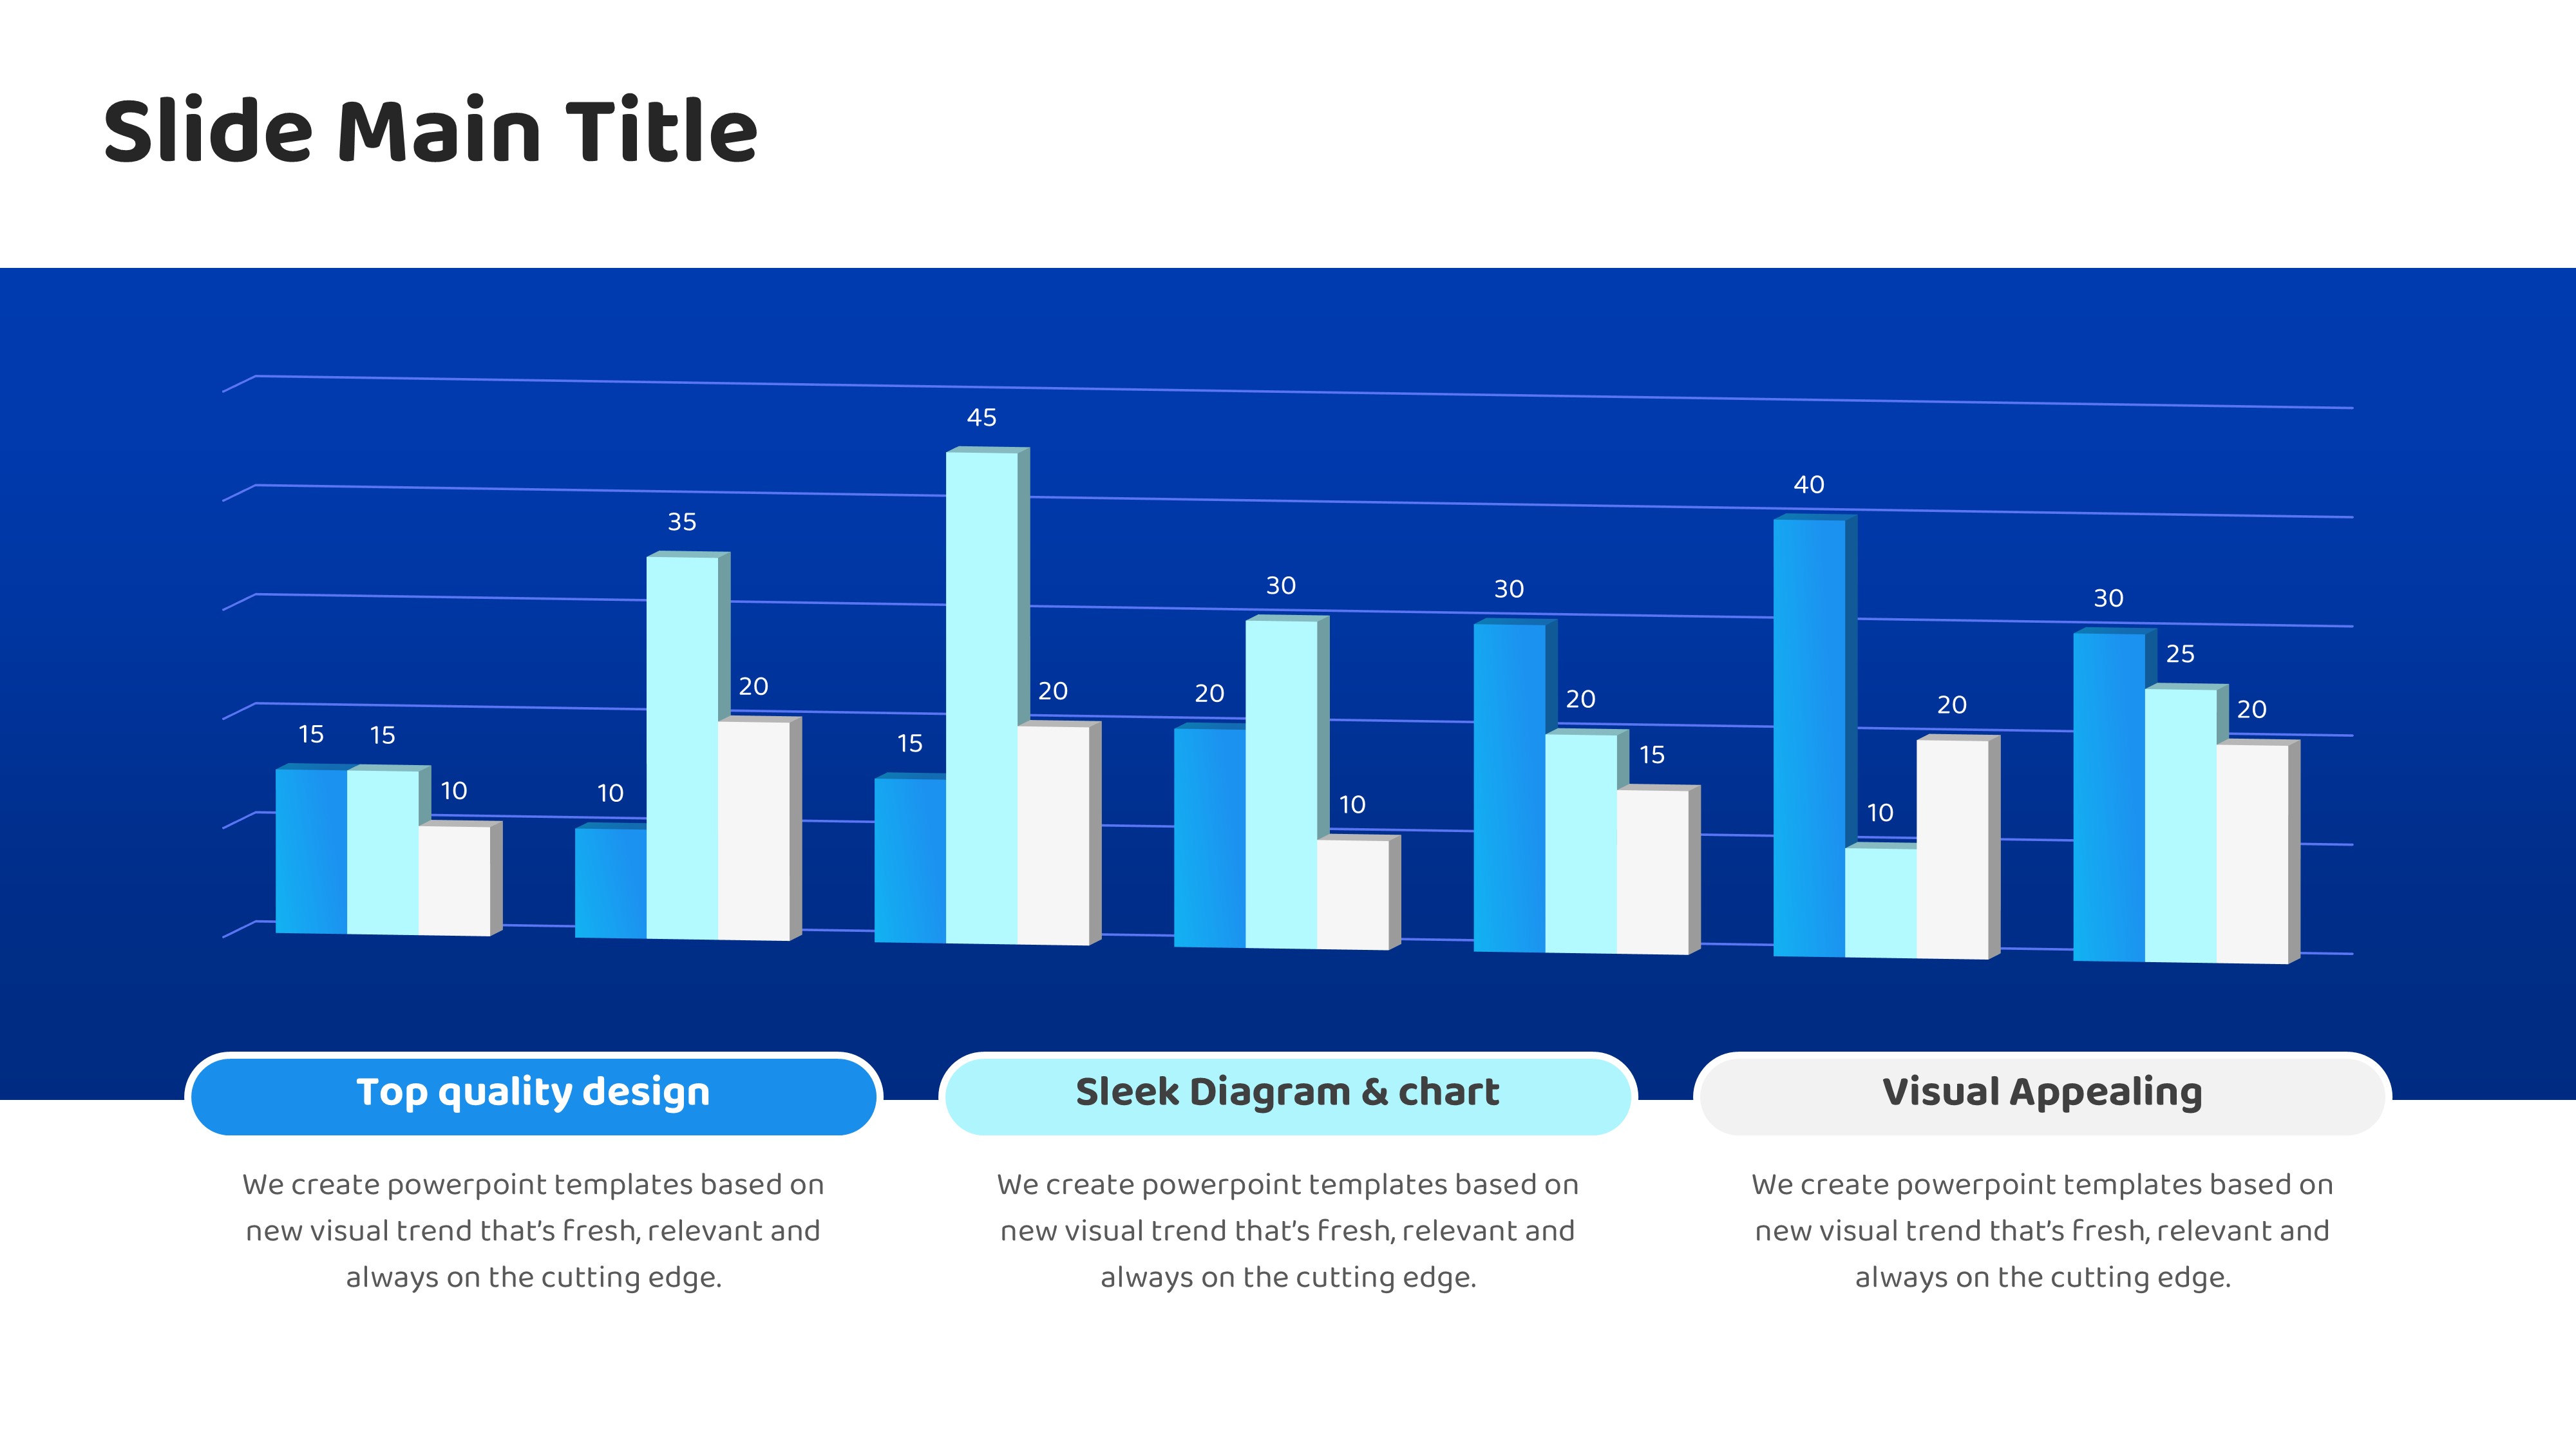
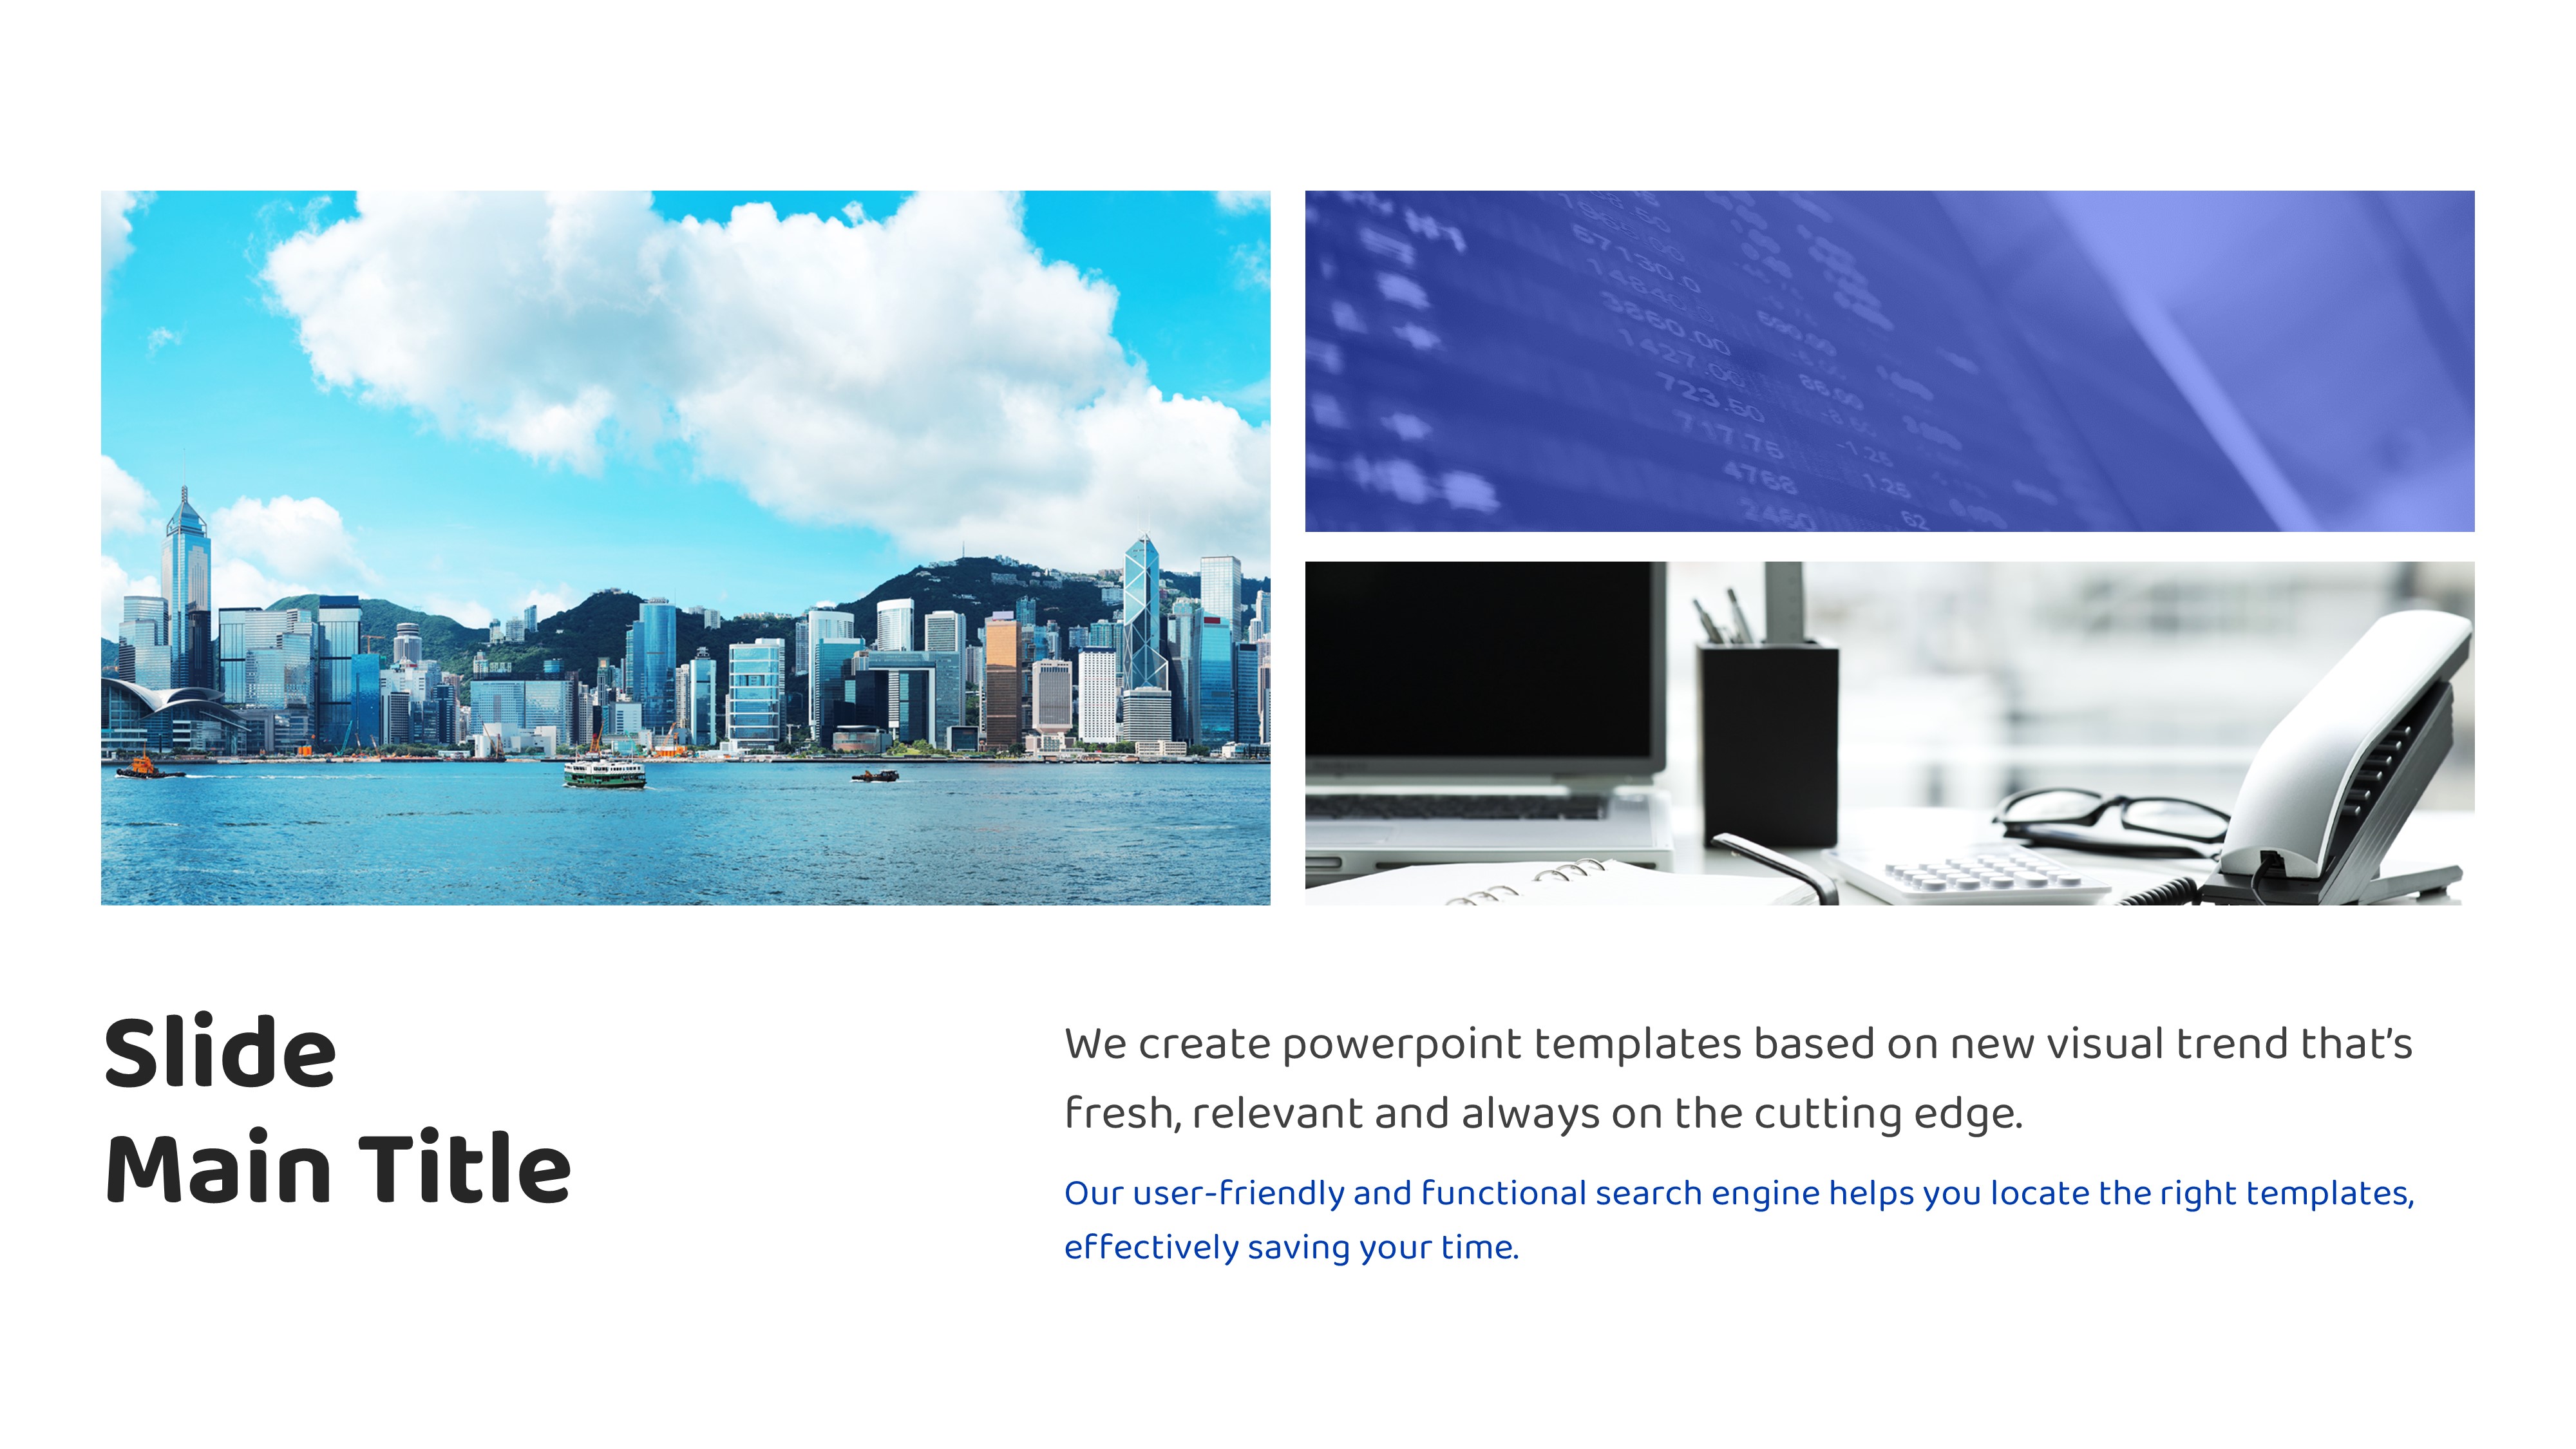
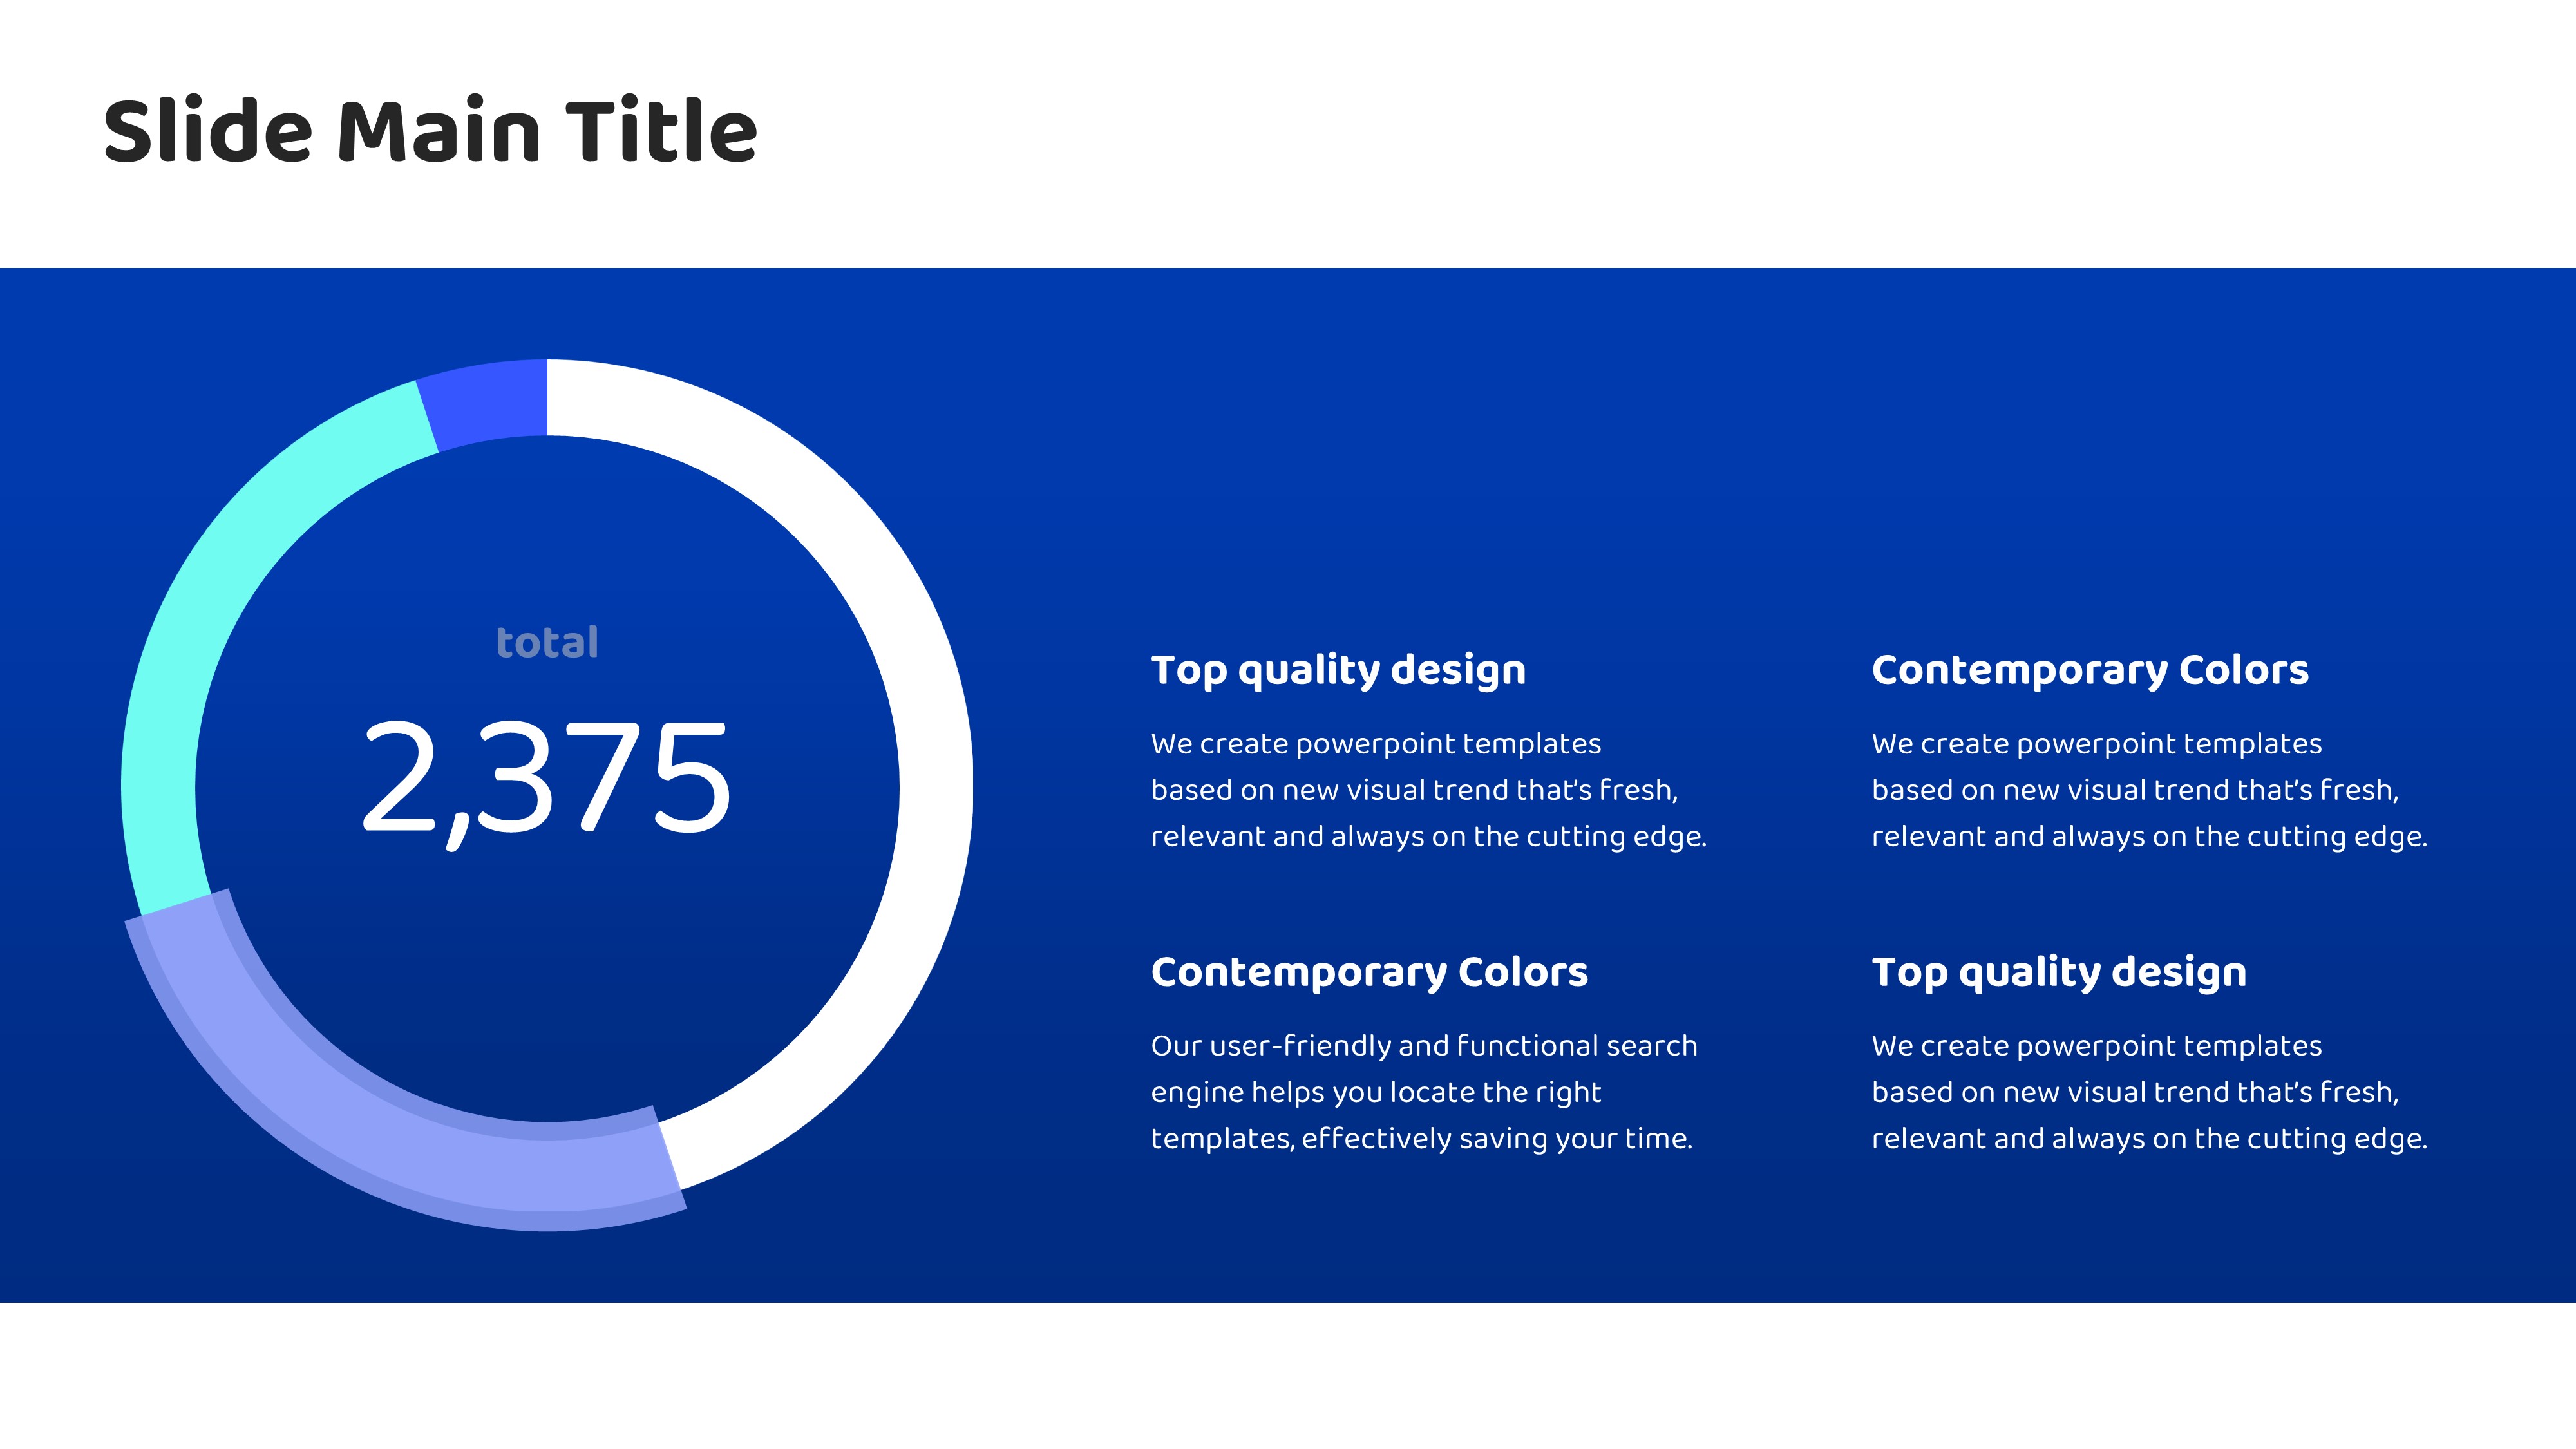
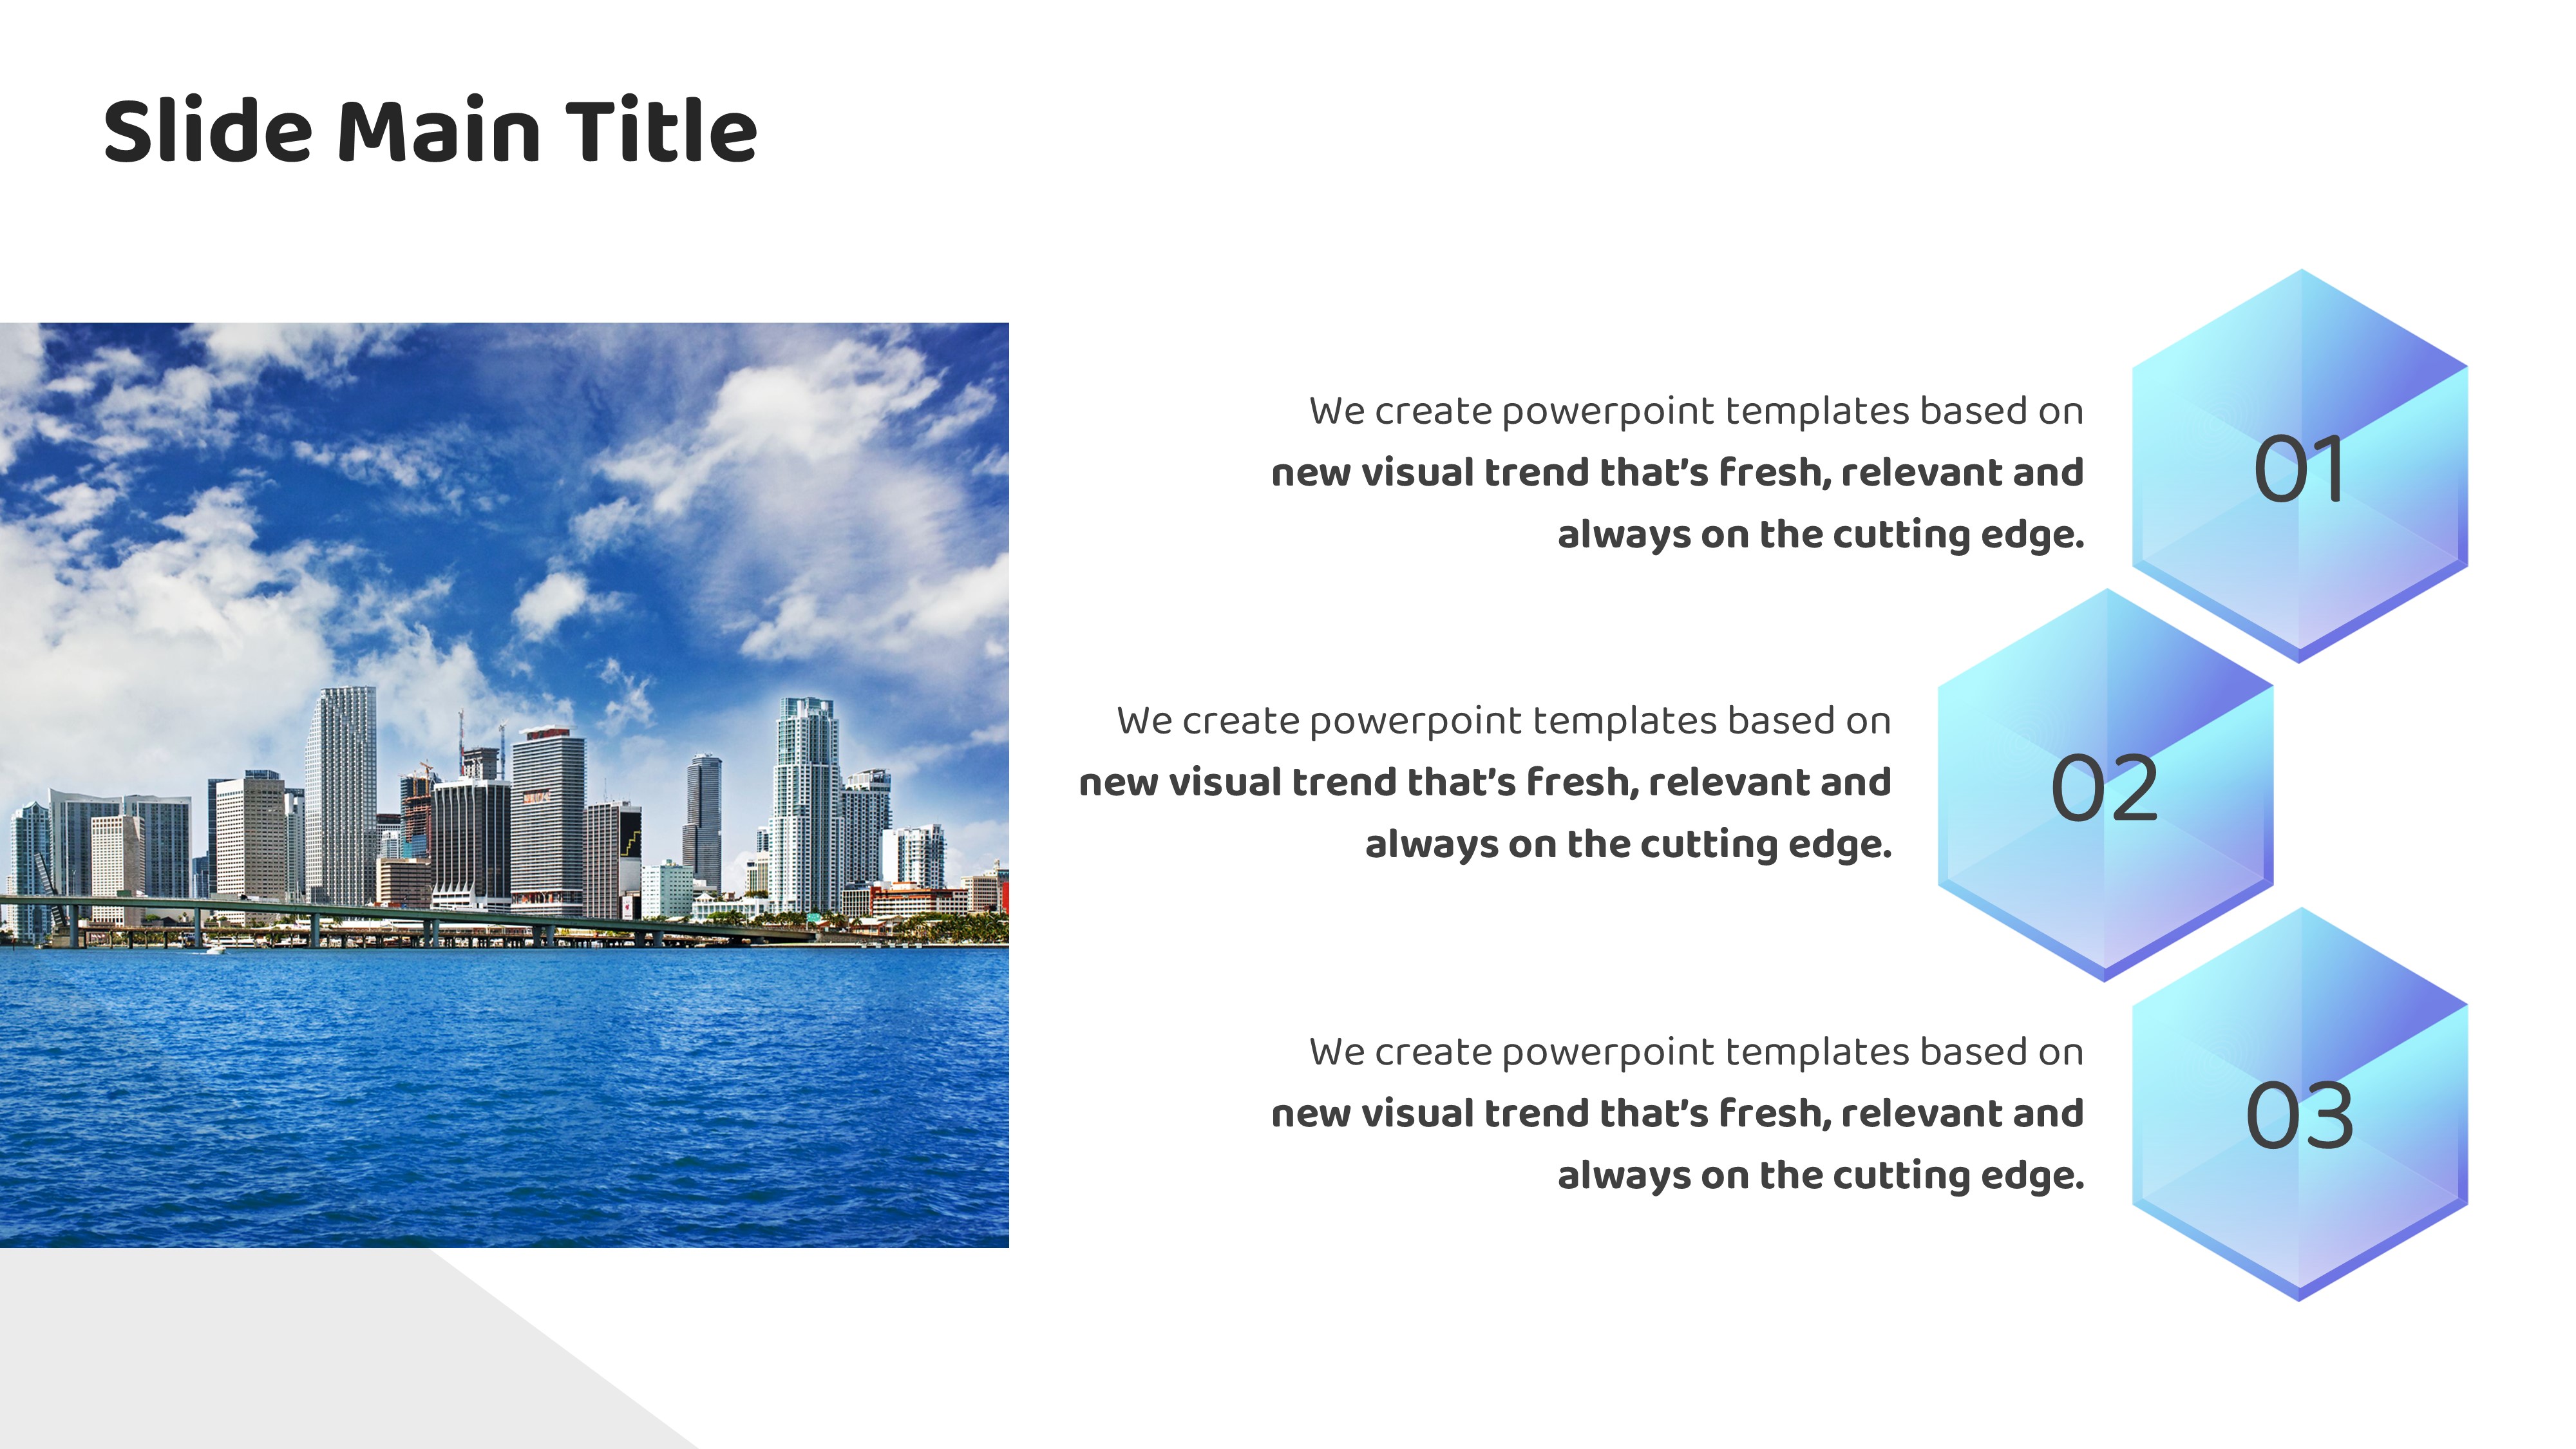
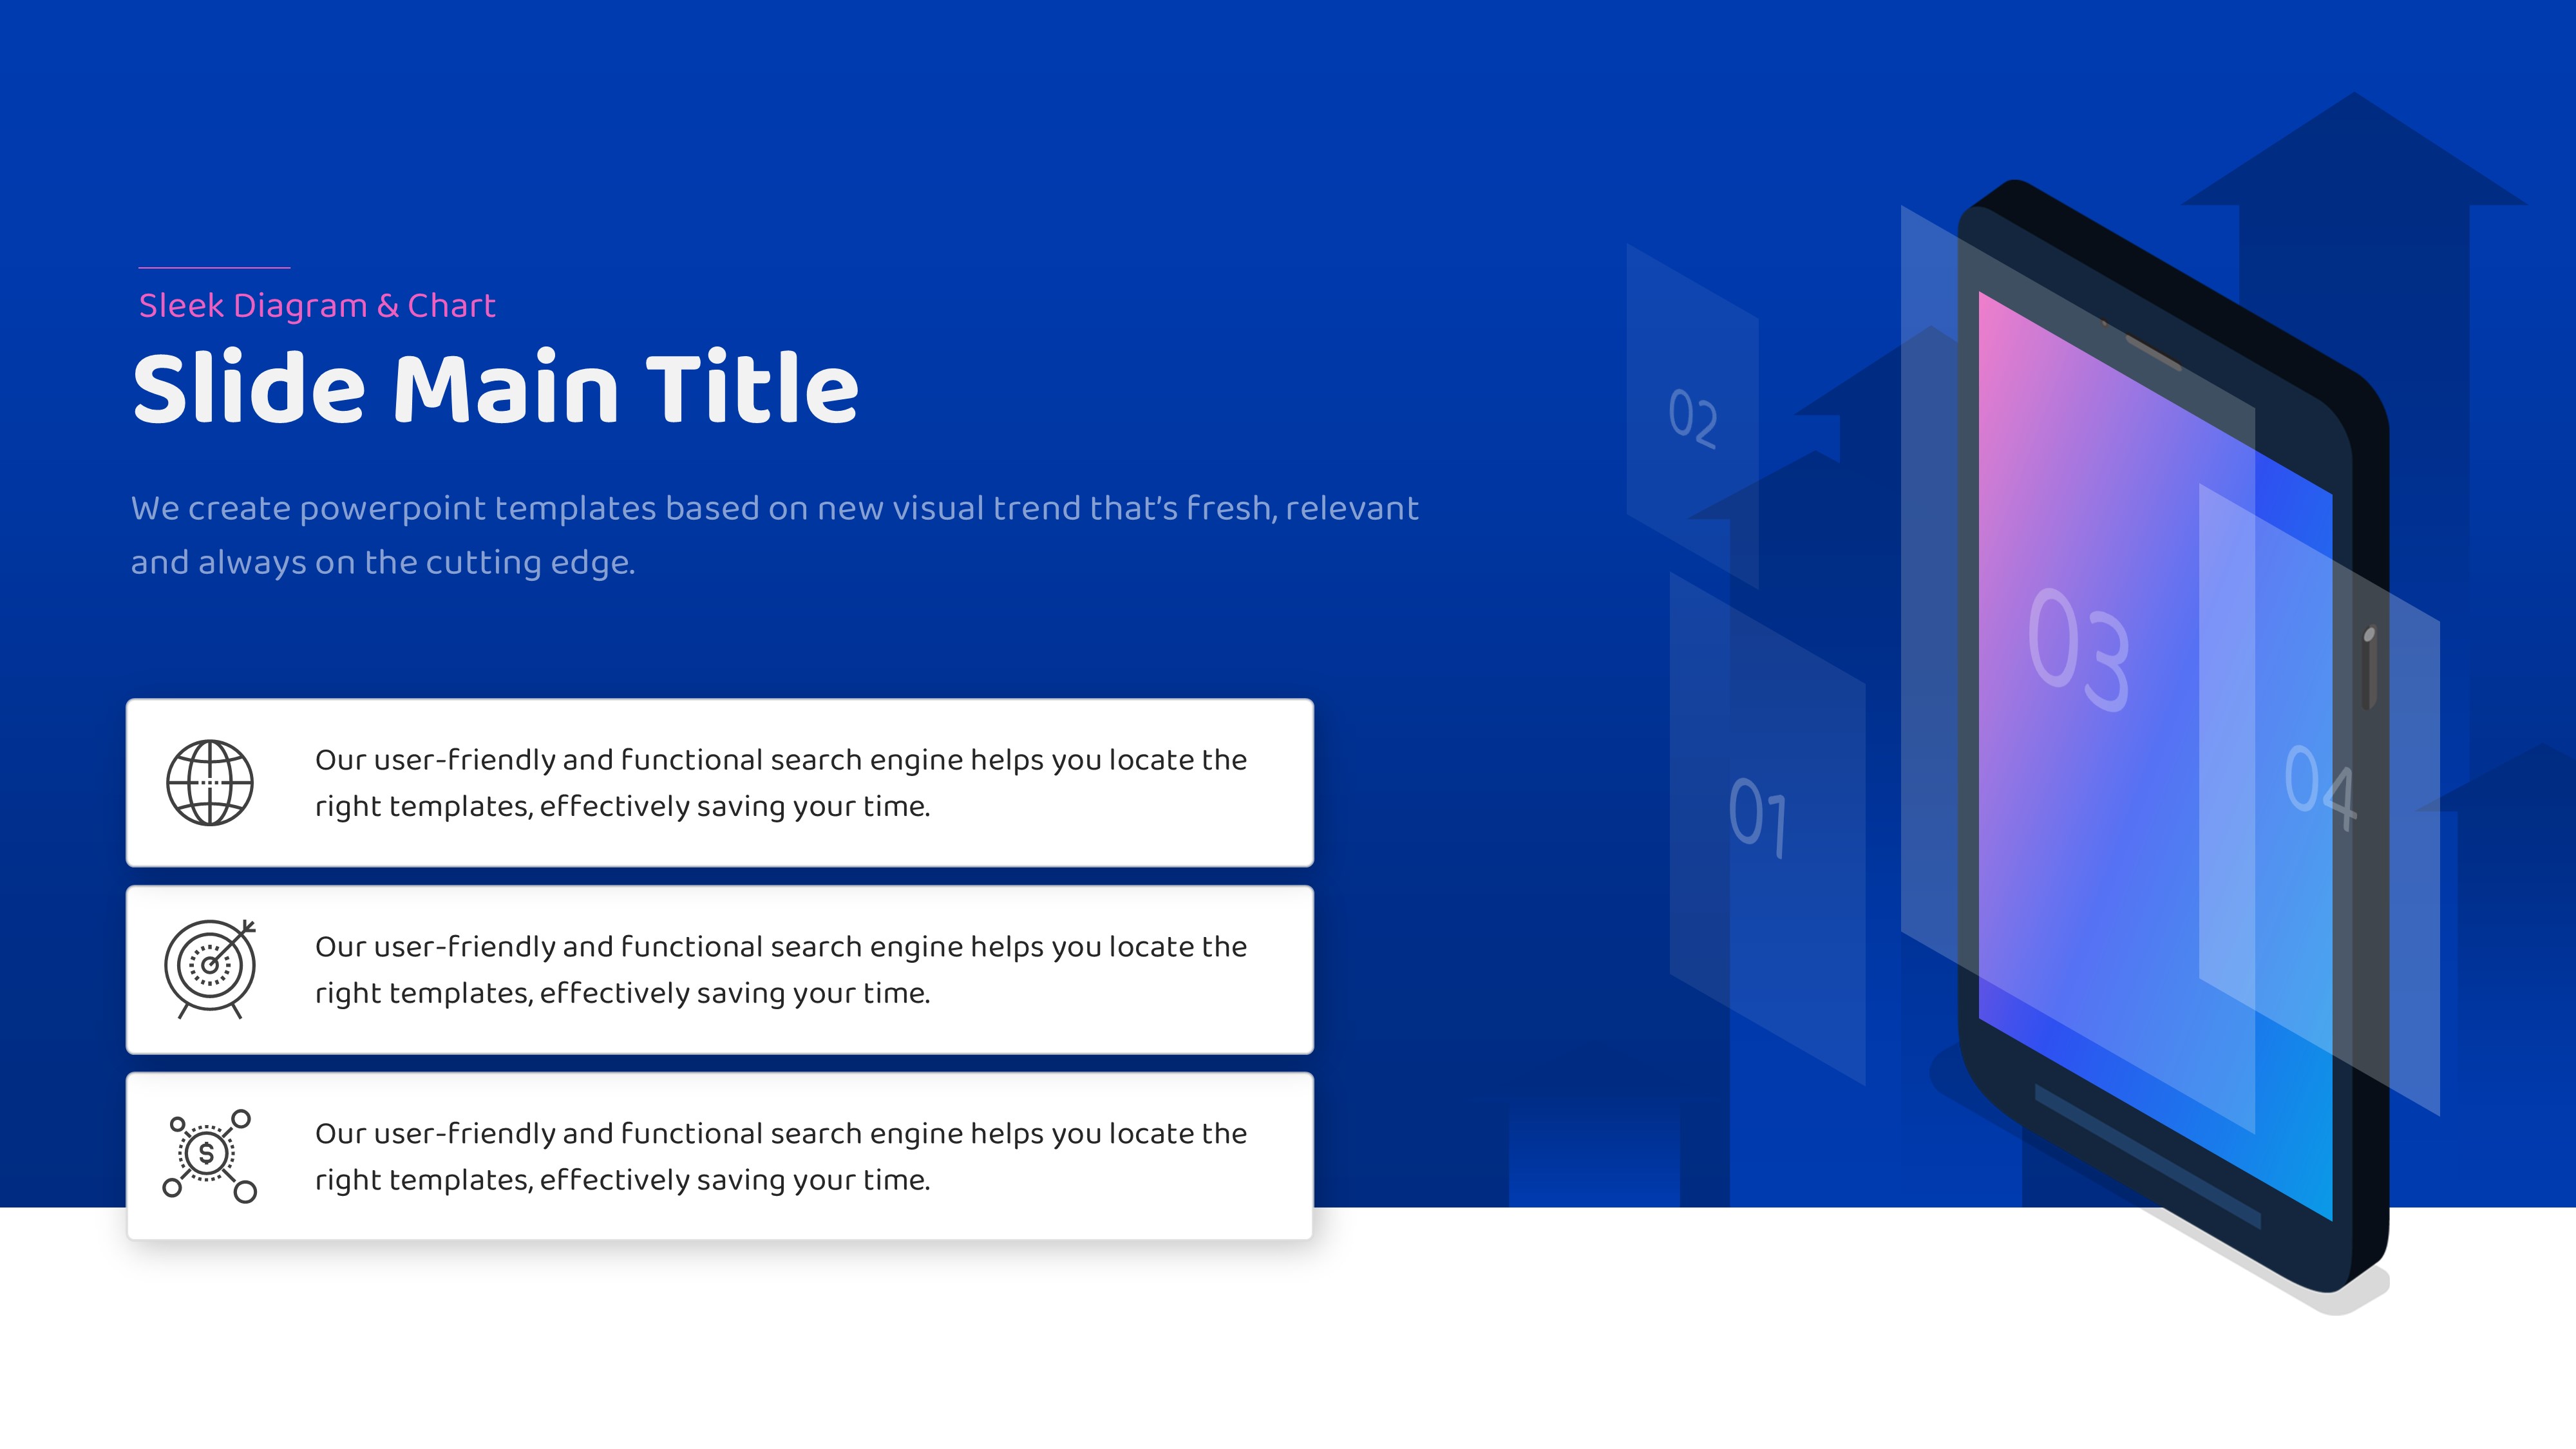
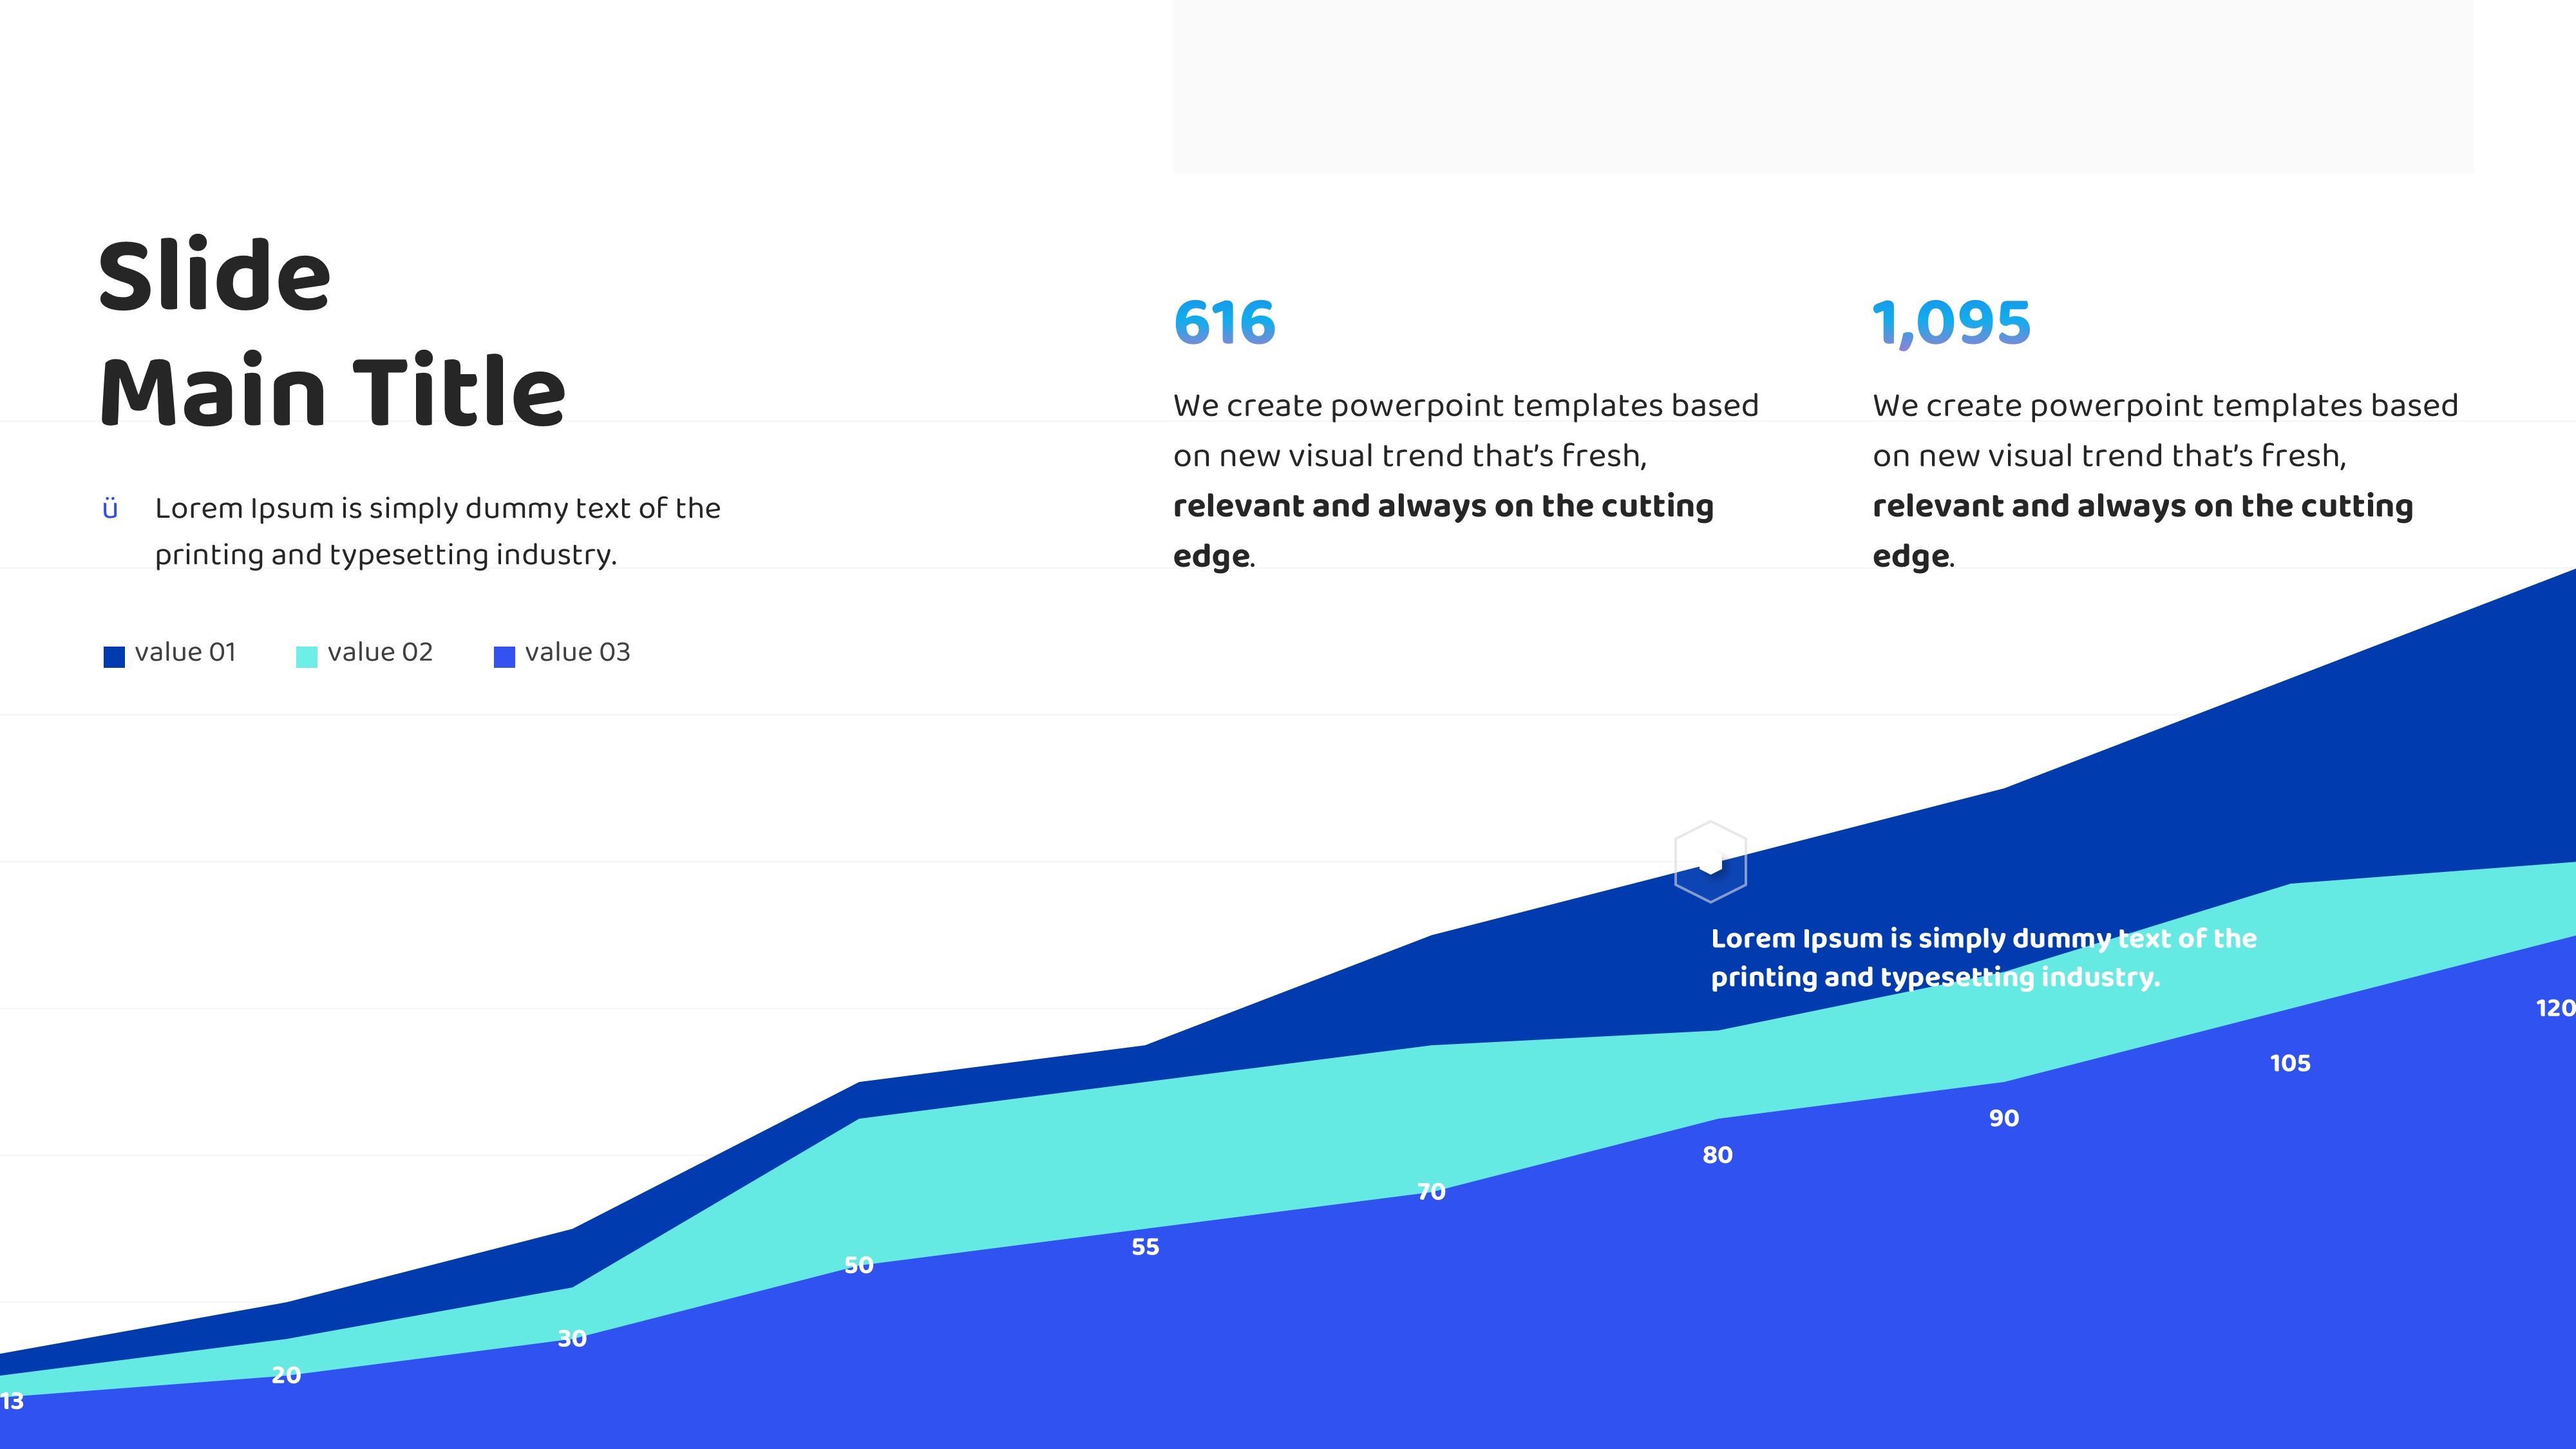
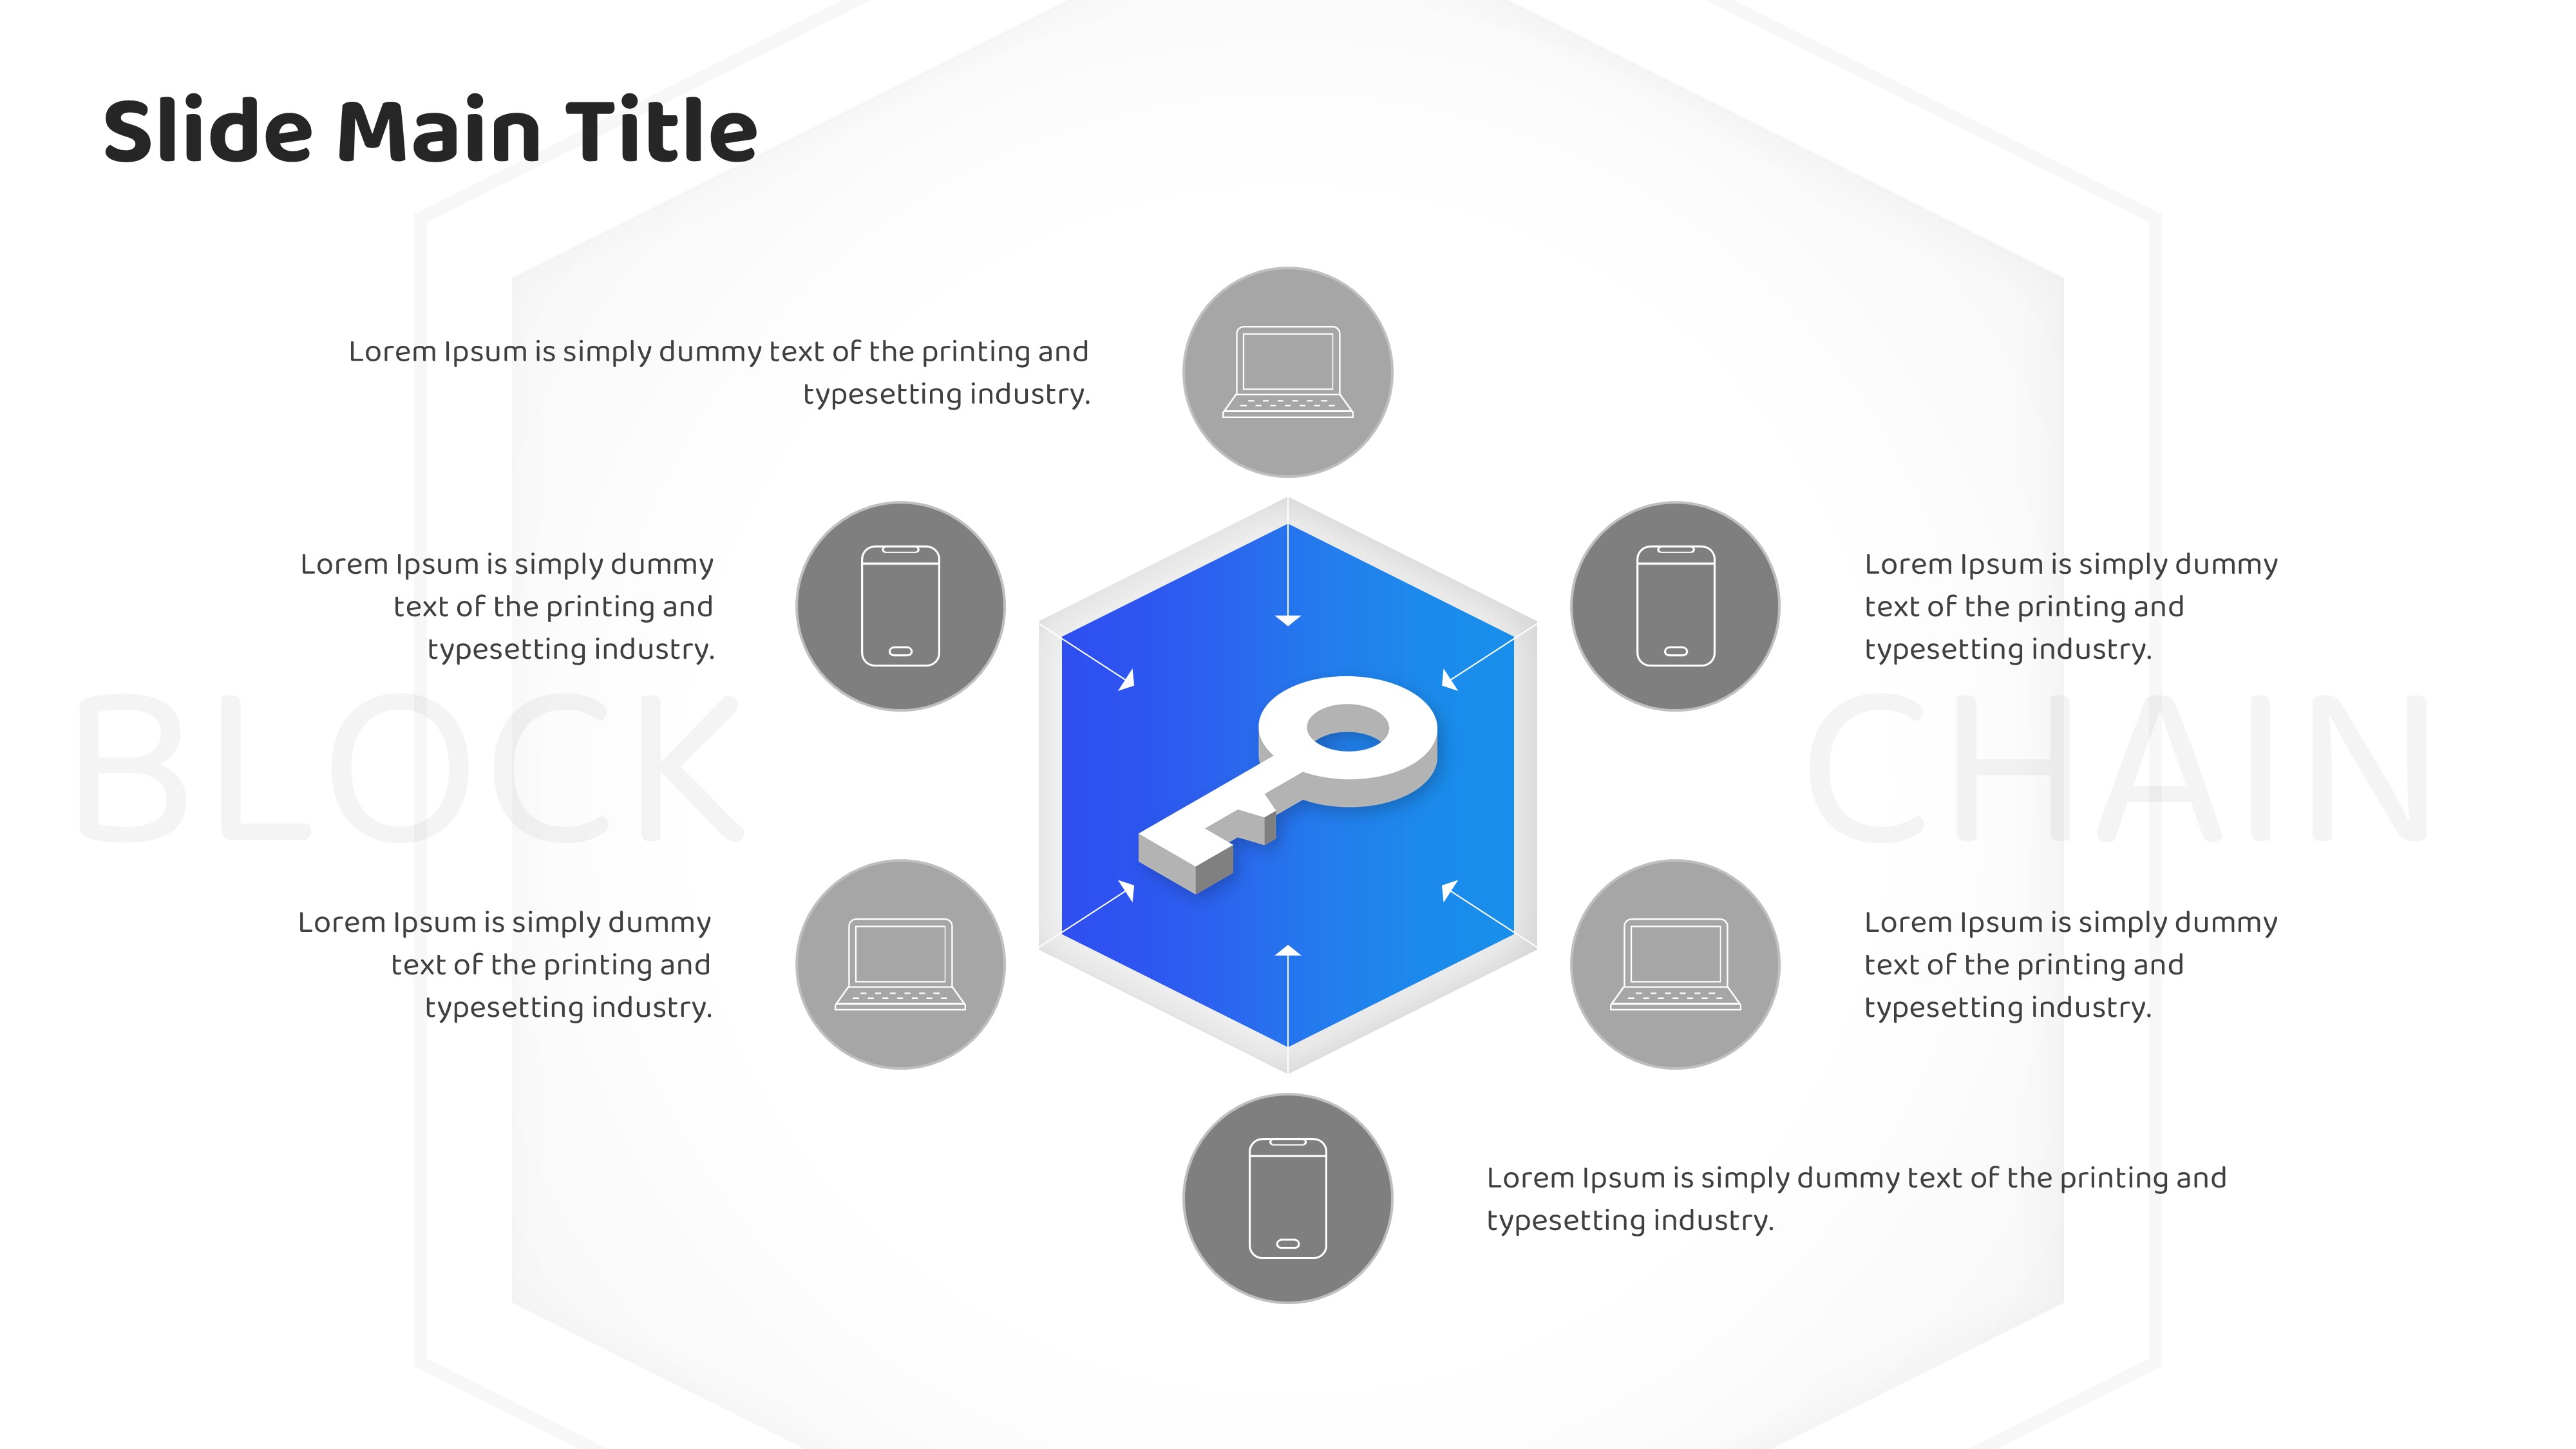
Cover slide with 3D blockchain node illustration / image collage slide (city, code, office in three panels) / hexagon 6-icon mission diagram / KPI metric cards (3 values) / line and bar chart data slides / 4-column icon card layout — 30 slides total.


