Comparative Analysis Area Graph – Enhancing Market Competitiveness
RJ0400064_25
- Last Update 06/04/2025
- File Size 0.2MB
- # of Slides 2
- File Format PPTX
- Slide Ratio 16:9
- Color
Keywords
About the Product
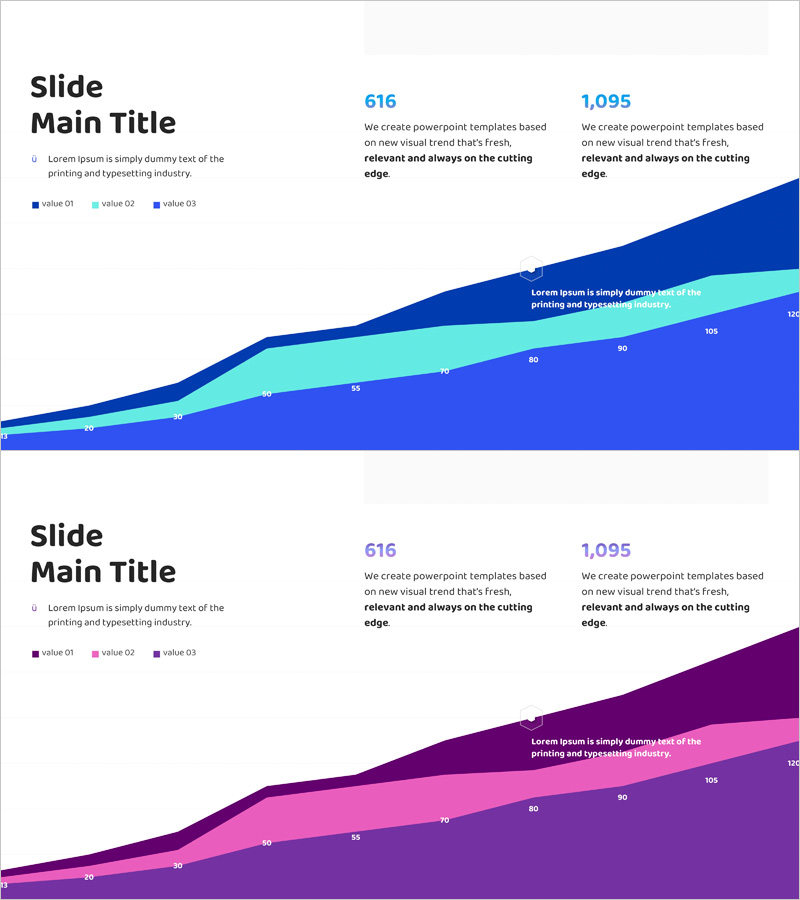
A 2-slide area chart PowerPoint template designed for market competitiveness analysis and comparative data visualization. The stacked area chart features four color gradients—navy blue, light blue, pink, and purple—to represent multiple data series over time. The left-side title and description area pairs with a large right-side chart zone in a 2-column layout, making it ideal for business presentations, executive reports, and market analysis documents. Delivered in 16:9 widescreen PPTX format for seamless compatibility across all presentation platforms.
Usage Points
-
Main Usage
Visualize multiple data series—such as market share, competitor revenue, or sales trends—as cumulative areas over time to support competitive analysis and market trend identification. Strengthens data-driven decision-making in investor presentations, executive briefings, and strategic planning sessions.
-
How to Use
Enter your analysis title and description in the left-side text area. Replace the sample data in the right-side area chart with your actual figures, then adjust the legend labels and numeric values to match your presentation context.
-
Recommended For
Marketing managers, executives, strategy planners, and financial analysts conducting market analysis, competitive positioning studies, and revenue reporting. Ideal for business plans, investor pitch decks, executive reports, and market analysis sections.
-
Slide Structure
Both slides feature identical layout: left-side title area (1 line), left-side description text (2–3 lines), left-side legend (3 items), and right-side stacked area chart (4 color series, 100–105 numeric range). Contains 4 text input fields and comparison-type data hierarchy supporting 3–4 simultaneous data series.
Related Products
-

Five Color Powerpoint Template Wide – Charts and Mockups
#Market and Competitor Analysis #Graph #Other
-

Partial Highlight Area Graph – Market Trends and Competitive Advantage
#Market and Competitor Analysis #Graph #Other
-

Weather Area Chart – Market Trend Analysis
#Market and Competitor Analysis #Graph #Other
-

Illustration Glass Bottle Segmentation Graph – Market Trend Analysis
#Market and Competitor Analysis #Graph #Other
