IT Financial Business Company Overview – Trust and Innovation Infographic
RJ0400064_21
- Last Update 06/04/2025
- File Size 1.5MB
- # of Slides 2
- File Format PPTX
- Slide Ratio 16:9
- Color
Keywords
About the Product
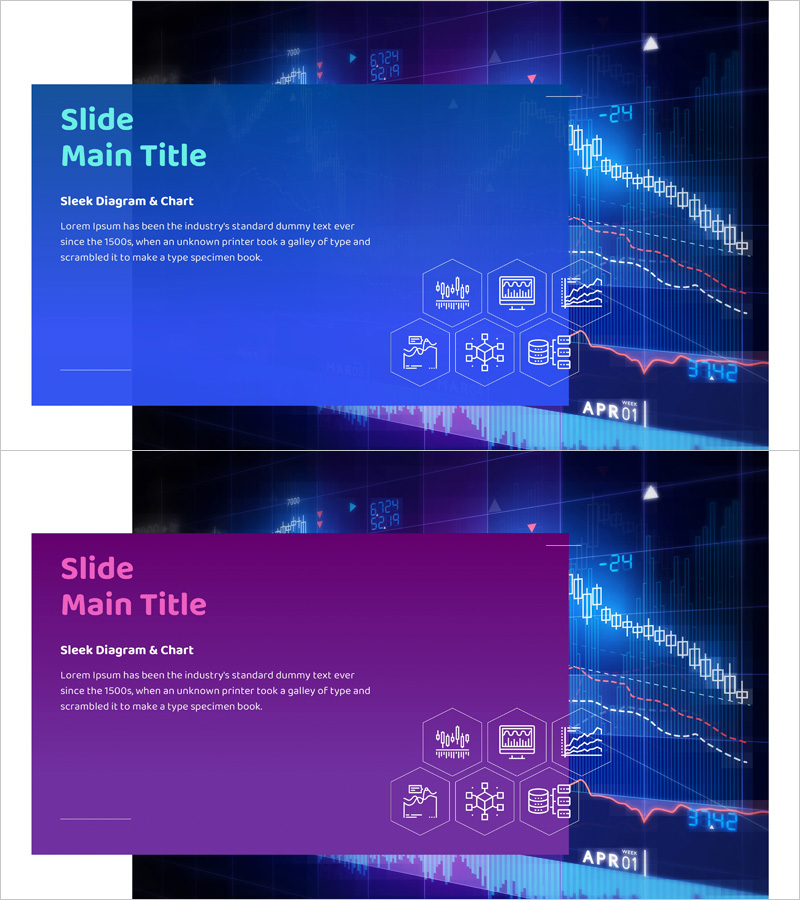
A 2-slide PowerPoint presentation template designed to visualize IT financial business company overview. Features a dark blue and purple gradient background with integrated charts, icons, and text boxes in an infographic layout. The left side contains a title area while the right side displays data visualization elements, enabling clear communication of business status, core competencies, and performance metrics. Available in 16:9 widescreen PPTX format, fully editable and optimized for the business overview section of corporate presentations.
Usage Points
-
Main Usage
Designed for the business overview section of corporate presentations. Effectively communicates company business divisions, core competencies, and performance metrics through charts and icons. Builds investor confidence, supports partnership proposals, and conveys organizational credibility to diverse audiences including stakeholders, partners, and new employees.
-
How to Use
Enter your business overview title or key business area name in the left title section. Input company business divisions, revenue data, growth rates, and other metrics in the right visualization area. All text boxes, charts, and icons are fully editable and can be customized to match your corporate brand colors and style preferences.
-
Recommended For
Ideal for IT companies, financial institutions, and startups presenting corporate overviews. Particularly effective for investor relations presentations, partnership proposals, employee onboarding, and client confidence-building presentations. Suitable for any business presentation requiring simultaneous display of numerical data and visual representation.
-
Slide Structure
2-slide layout with each slide divided into left title area (1 text input field) and right data visualization area (2-3 charts, 6 icons, 2-3 text boxes). Blue-purple gradient background with line graphs, bar charts, and hexagonal icons create clear information hierarchy, making complex data intuitive and easy to understand at a glance.
Related Products
-

Stock Business Overview Slide – Visualizing Stock Market Data
#Company Introduction #Business Introduction #Company Overview
-

Company Overview Plus Diagram – Vision and Strategy
#Company Introduction #Business Introduction #Business Vision and Strategy
-

Timepiece Theme Company Overview - Business Insights and Presentation
#Company Introduction #Business Introduction #Diagram
-

Line Drawing Theme Topic Overview
#Company Introduction #Business Introduction #Diagram
