Introduction to IT Financial Services Business Program – Modern Visual Diagrams
RJ0400064_22
- Last Update 06/04/2025
- File Size 1.1MB
- # of Slides 2
- File Format PPTX
- Slide Ratio 16:9
- Color
Keywords
About the Product
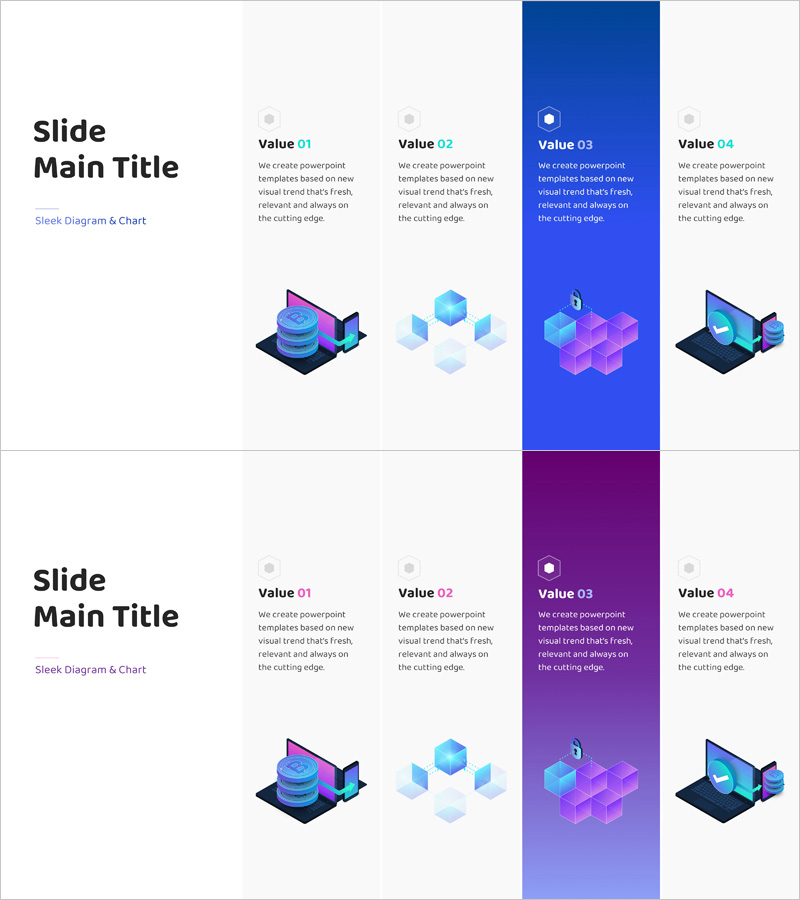
A 2-slide PowerPoint template designed to introduce IT financial services business programs with visual impact. The layout presents four core values (Value 01–04) in a side-by-side comparison structure, each paired with isometric 3D illustrations and descriptive text blocks. The first slide features a dark blue accent column, while the second uses a purple accent column to create visual progression throughout your presentation. Technology icons representing databases, cloud services, and AI convey the innovation at the heart of IT finance. Ample text input areas in each section enable easy customization for your organization's specific messaging. Ready to deploy in business proposals, service introductions, and operational planning presentations.
Usage Points
-
Main Usage
Clearly communicate four core values of IT financial services using a left-right comparison structure, simultaneously visualizing technical capabilities and business impact. Ideal for the service introduction section of investor pitches, partner presentations, and internal stakeholder briefings.
-
How to Use
Replace the 'Value 01–04' text boxes with your organization's key services, technologies, or value propositions. Swap the isometric icons with your company logo or service imagery. The blue and purple accent columns maintain visual continuity while clearly distinguishing information across slides.
-
Recommended For
IT finance companies presenting business proposals and investor relations materials, fintech solution providers conducting client briefings, fintech startups pitching to investors, financial services consulting firms delivering strategy reports, and technology-driven financial institutions explaining service differentiation.
-
Slide Structure
Two-slide set with four sections (Value 01–04) arranged horizontally on each slide. Each section contains a title, descriptive text area, and isometric 3D illustration. Color progression from dark blue (slide 1) to purple (slide 2) creates visual hierarchy and guides audience attention through your key messages.
Related Products
-

Global Export Process Diagram – Efficiency Summary for Business Operations
#Product/Service Introduction #Operational Plan #Diagram
-

Introduction to Business Program Slide – Emphasizing Trust and Efficiency
#Product/Service Introduction #Operational Plan #Program Introduction
-

Football Game Process for Victory – Strategic Operational Planning
#Product/Service Introduction #Operational Plan #Diagram
-

Rainbow Paper Presentation Template Text Box
#Product/Service Introduction #Operational Plan #Text Box
