IT Financial Services Overview – Innovative Diagrams
RJ0400064_19
- Last Update 06/04/2025
- File Size 0.4MB
- # of Slides 2
- File Format PPTX
- Slide Ratio 16:9
- Color
Keywords
- #Content-Based Slides
- #Design-Based Slides
- #Product/Service Introduction
- #Diagram
- #Program Introduction
- #Product and Service Overview
- #Cluster
- #Closed Cluster Diagram
- #16:9
- #cluster diagram PowerPoint
- #IT financial services presentation
- #3-item diagram slide
- #closed-form diagram
- #isometric icon PPT slide
About the Product
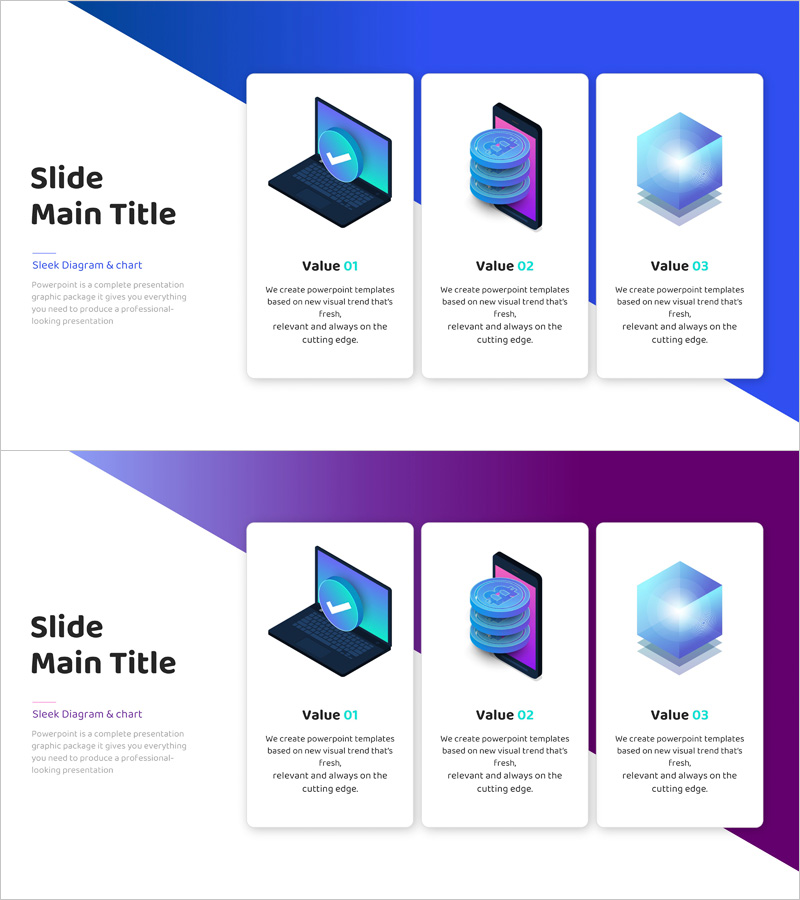
A cluster diagram PowerPoint slide presenting IT financial services with three core value items in a closed-form structure. The design features isometric icons (laptop, database, cube) radiating from a central concept, with white card layouts on a blue gradient background. Each item includes a label (Value 01/02/03) and descriptive text, creating clear information hierarchy. The 2-slide set offers both blue and purple gradient background options, allowing you to match your presentation theme. Perfect for technology-driven financial solutions and innovation-focused pitches.
Usage Points
-
Main Usage
Visually organize three core value propositions of IT financial services and clearly communicate the role and relationships between each item. Helps audiences quickly grasp the information structure and enhances understanding during technology-focused financial solution presentations.
-
How to Use
Select text boxes and icons in the slide master to replace with your service item names and descriptions. Choose the blue or purple background version that matches your corporate brand colors, and adjust text length in each card to maintain layout balance. Icons can be replaced with alternative images from the library.
-
Recommended For
Ideal for corporate presentations by financial institutions, fintech startups, and IT consulting firms. Particularly effective for investor pitches, product introductions, and strategy meetings where you need to explain 3-4 core value items of technology-based financial solutions. Suitable for executive briefings, board meetings, and client proposal slides.
-
Slide Structure
2-slide set with consistent layout. Each slide divides into a left title area (Slide Main Title + subtitle) and right section with 3 cards. Each card contains an isometric icon (top), item label (Value 01/02/03), and descriptive text (bottom), with uniform spacing between cards. Backgrounds differentiate with blue and purple gradient options.
Related Products
-

Introducing Mobile Business Services – Innovation and Convenience
#Product/Service Introduction #Diagram #Program Introduction
-

Shopping Mall Product Purchase Analysis – Insights Through Data Visualization
#Product/Service Introduction #Diagram #Program Introduction
-

Mobile Service Segmentation Closure Diagram
#Product/Service Introduction #Diagram #Program Introduction
-

Aerospace Industry Introduction Diagram – Visualizing Cluster Information
#Product/Service Introduction #Diagram #Program Introduction
