Detailed Analysis Circle Graph Presentation Template
RJ0400064_16
- Last Update 06/04/2025
- File Size 0.2MB
- # of Slides 2
- File Format PPTX
- Slide Ratio 16:9
- Color
Keywords
- #Content-Based Slides
- #Design-Based Slides
- #Product/Service Introduction
- #Market and Competitor Analysis
- #Graph
- #Development Status
- #Market Analysis
- #Circles
- #Doughnut Chart
- #16:9
- #donut chart PowerPoint slide
- #pie chart presentation template
- #data visualization slides
- #circular graph PPT
- #market analysis chart template
About the Product
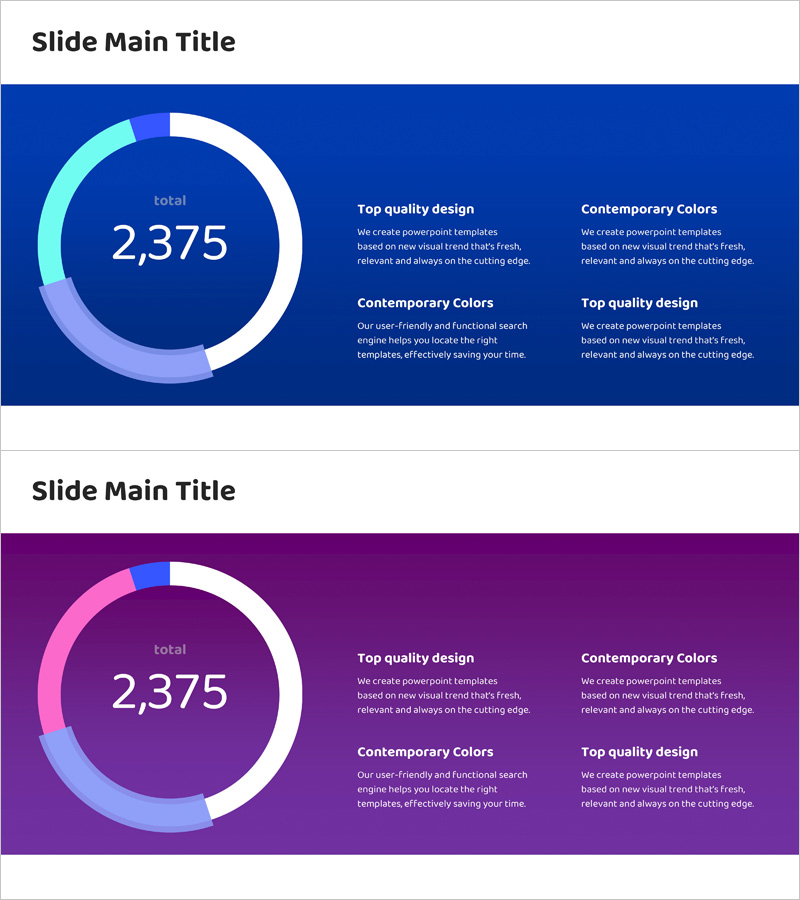
A donut-shaped pie chart PowerPoint slide that emphasizes central numerical data. Designed with dark blue and purple backgrounds featuring cyan-to-pink gradient rings for market analysis, detailed breakdowns, and ratio representation. The 2-slide set offers multiple color combinations (blue and purple palettes), with a center area for total figures, percentages, or key metrics. The right side includes four text boxes for item descriptions, supporting data interpretation. Formatted in 16:9 widescreen ratio for modern presentation environments and ready for immediate editing in PPTX format.
Usage Points
-
Main Usage
Visualize overall composition ratios, market share, and detailed analysis results using a donut-shaped pie chart that emphasizes central figures. Four description areas clarify the meaning of each component, making key metrics stand out in data sections of reports, proposals, and marketing plans.
-
How to Use
Enter total figures, percentages, or key metrics in the center area, then fill the four text boxes on the right with item names and descriptions. Adjust the donut ring colors and thickness to match data proportions, and select background colors (blue or purple) to align with presentation themes. Standardize fonts, sizes, and alignment through the slide master for consistent report formatting.
-
Recommended For
Ideal for market analysis presentations, business performance reports, investor pitch decks, marketing performance reviews, and product positioning talks. Effective for finance teams, marketing departments, executives, and consultants explaining quantitative data intuitively. Also suitable for academic presentations, seminars, and educational materials requiring clear ratio concepts.
-
Slide Structure
2-slide set. Each slide features a donut pie chart on the left (1 ring, 4 segments with center emphasis) and 2×2 text box layout on the right. Slide 1: blue background with cyan-white-light blue gradient ring. Slide 2: purple background with pink-white-light blue gradient ring. 16:9 widescreen format, PPTX file.
Related Products
-

Doughnut Chart Slide for 3D Printing Machine Technology Status
#Product/Service Introduction #Market and Competitor Analysis #Graph
-

Port Transport Data & Comparison Chart – Optimized for Market and Competitor Analysis
#Product/Service Introduction #Market and Competitor Analysis #Graph
-

Successful Data Analysis Donut Graph
#Product/Service Introduction #Market and Competitor Analysis #Graph
-

Development Analysis Donut Graph – Visual Data Presentation
#Product/Service Introduction #Market and Competitor Analysis #Graph
