Stock Market Trend Graph
RJ0400064_12
- Last Update 06/04/2025
- File Size 0.2MB
- # of Slides 2
- File Format PPTX
- Slide Ratio 16:9
- Color
Keywords
- #Content-Based Slides
- #Design-Based Slides
- #Market and Competitor Analysis
- #Graph
- #Market Analysis
- #Industry Trends
- #Column
- #Line
- #Column Chart
- #Line Chart
- #16:9
- #line chart PowerPoint
- #stock market trend slide
- #dual series chart template
- #financial graph presentation
- #market analysis PowerPoint slide
- #how to create line chart in PowerPoint
About the Product
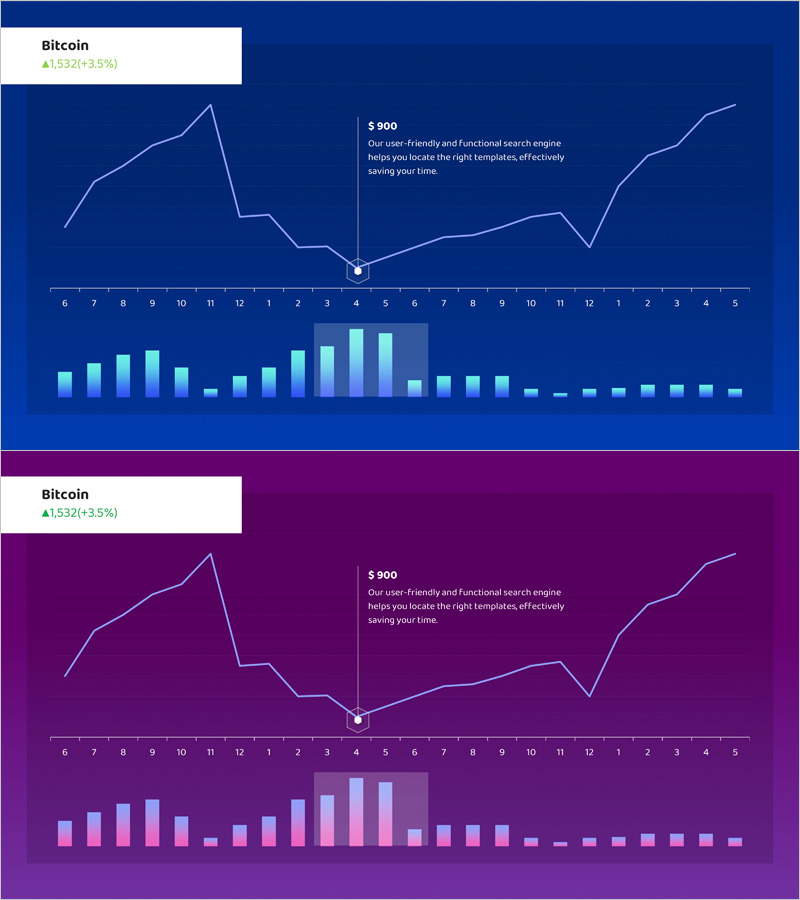
A dual-series line chart PowerPoint slide designed to visualize stock market trends over time. The slide combines two trend lines with a bar chart at the bottom to simultaneously display price movements and trading volume across time periods. Available in dark blue and purple background options, each slide is formatted in 16:9 widescreen PPTX. Perfect for financial reports, investment presentations, and market analysis decks where numerical trends need clear visual representation. The layout is ready for immediate use in professional presentations.
Usage Points
-
Main Usage
Visualizes time-series stock price movements and trading volume simultaneously, making complex financial data easy to understand. Ideal for comparing multiple data series such as investment returns, market indices, and economic indicators.
-
How to Use
Use in the market analysis section of financial reports, investor briefing materials, and quarterly earnings presentation decks to emphasize trend changes. The editable structure automatically updates graphs when data is entered.
-
Recommended For
Financial analysts, investment managers, economic researchers, financial consultants, and securities professionals who create market trend analysis materials. Also suitable for executive briefing documents and board presentations.
-
Slide Structure
Two-slide set. Each slide features a dual-series line chart at the top (price trends), a reference line with annotation area in the center, and a bar chart at the bottom (trading volume). Available in dark blue and purple background options with 16:9 widescreen aspect ratio.
Related Products
-

Mobile Market Analysis Bar & Line Charts – Trend Visualization
#Market and Competitor Analysis #Graph #Market Analysis
-

Blue Yellow Line Graph – Market and Competitive Analysis
#Market and Competitor Analysis #Graph #Market Analysis
-

Line Chart for Performance Variation Visualization – The Basics of Presentation
#Market and Competitor Analysis #Graph #Market Analysis
-

Consumer Insights & Behavioral Patterns Analysis Slide
#Market and Competitor Analysis #Graph #Market Status
