Stock Business Overview Slide – Visualizing Stock Market Data
RJ0400064_27
- Last Update 06/04/2025
- File Size 1MB
- # of Slides 2
- File Format PPTX
- Slide Ratio 16:9
- Color
Keywords
About the Product
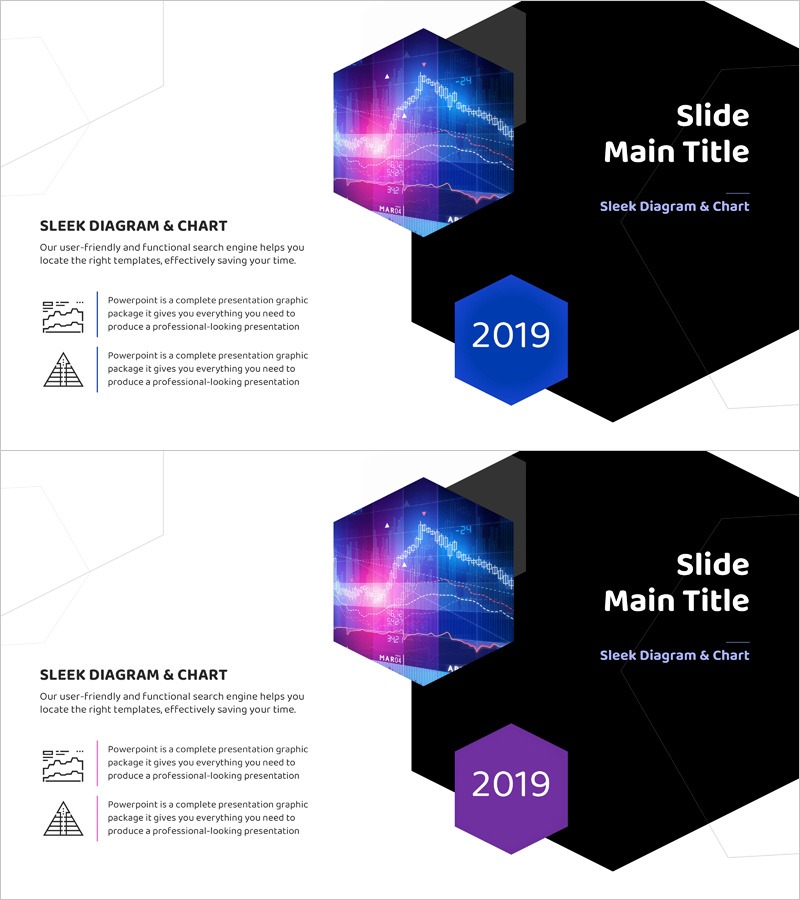
A 2-slide PowerPoint presentation designed to communicate stock business overview through visual data representation. The left side features two icon-based text areas for business description, while the right side displays a 3D hexagon data visualization element. The modern color palette of blue, pink, and black conveys trust and professionalism in finance and technology sectors. Available in 16:9 widescreen PPTX format for immediate editing. The layout accommodates stock market data, business performance metrics, and investment returns. Optimized for business overview sections in company profiles, business plans, and investor presentations.
Usage Points
-
Main Usage
Presents key business overview and market data at a glance for stock-related ventures. The left text area accommodates business descriptions while the right hexagon visualization displays critical metrics and figures, building investor and partner confidence through data-driven presentation.
-
How to Use
Integrate into company profile business overview sections, business plan introductions, or investor presentation business model explanations. Input core business information in left icon text boxes and key metrics—revenue, profit margins, market share—in the right hexagon to construct data-backed presentations.
-
Recommended For
Finance, investment, and securities professionals; startup founders; business development managers; and investor relations specialists. Ideal for stock market analysis, business performance reporting, and investment proposal presentations where data credibility is paramount.
-
Slide Structure
Two-slide layout with each slide divided into left text area (2 icons plus descriptive text) and right visualization area (3D hexagon plus year indicator). Features 2 text input areas and 1 data visualization area, creating a simple yet information-hierarchical structure.
Related Products
-

Introduction to Social Network Business Overview PowerPoint Template
#Company Introduction #Business Introduction #Company Overview
-

Big Data Analysis Company Overview - Current Data Trends
#Company Introduction #Business Introduction #Company Overview
-

Business Overview Semicircle Diagram – Effective Business Delivery
#Company Introduction #Business Introduction #Business Vision and Strategy
-

Introduction Effect Detail Analysis Diagram - Core of Business Strategy
#Company Introduction #Business Introduction #Business Vision and Strategy
