Financial Performance Analysis Table Slide – Data Visualization for Growth
RJ0400064_29
- Last Update 06/04/2025
- File Size 0.2MB
- # of Slides 2
- File Format PPTX
- Slide Ratio 16:9
- Color
Keywords
- #Content-Based Slides
- #Design-Based Slides
- #Financial Plans and Performance
- #Diagram
- #Income Statement
- #Key Financial Indicators
- #Table
- #Standard Table
- #16:9
- #financial table PowerPoint
- #performance analysis slide template
- #data table presentation
- #financial data visualization
- #comparison table slide download
About the Product
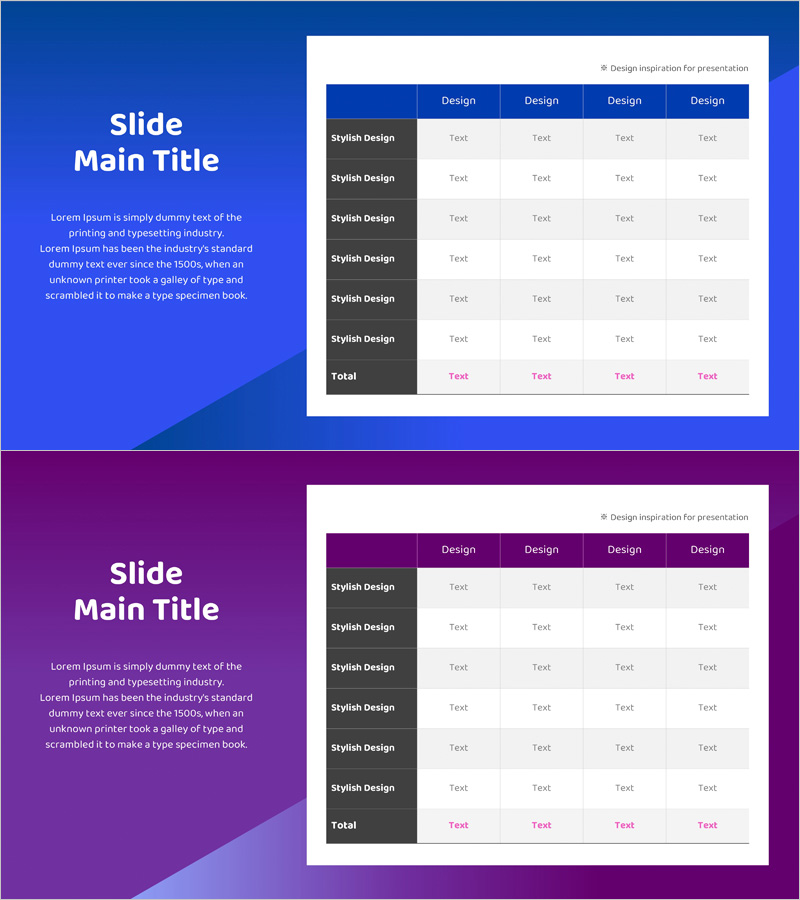
A professional financial performance analysis table PowerPoint slide with a 6-row by 4-column structure. Features blue and purple header designs that clearly distinguish data categories, with fully editable cells for immediate use. Perfect for organizing and visualizing financial metrics, revenue figures, expenses, and profit data in a structured format. The 2-slide set is designed in 16:9 widescreen ratio for modern presentation environments. Ideal for investor reports, executive briefings, quarterly performance presentations, and financial analysis meetings where credible data visualization is essential.
Usage Points
-
Main Usage
Organize and compare financial data such as revenue performance, sales figures, cost analysis, and profit margins in a clear tabular format. The distinct row and column structure enables quick comprehension of complex financial information, while header colors provide visual emphasis for data categories.
-
How to Use
Input financial line items (revenue, cost of goods sold, operating expenses, net profit) and corresponding figures into each cell. Use the blue slide for primary performance metrics and the purple slide for comparative analysis data. All colors, fonts, and cell sizes are fully customizable.
-
Recommended For
CFOs, financial analysts, executives, and investor relations professionals preparing quarterly and annual financial reports, board presentations, investor pitch decks, and business plan financial projections. Suitable for both internal management reviews and external stakeholder communications.
-
Slide Structure
6-row × 4-column grid containing 24 editable cells total. The header row features blue or purple background with white text for category labels. The remaining 5 rows have white backgrounds for data entry. The final row is designated for totals and highlighted in pink text for emphasis.
Related Products
-

Modern Styled Table Chart for Data Visualization – Clarity and Precision
#Financial Plans and Performance #Diagram #Income Statement
-

Table Chart of Point Frames – Profit and Loss Statement and Key Financial Metrics
#Financial Plans and Performance #Diagram #Income Statement
-

Business Income Statement – Visualizing Financial Performance
#Financial Plans and Performance #Diagram #Income Statement
-

Income Statement Table - Financial Performance Analysis
#Financial Plans and Performance #Diagram #Income Statement
